Science · three repeated views of one mobility problem
Why can walking hurt more than skating?
Troy reports that walking triggers disabling pelvic and hip pain, while controlled skating lets him keep moving. Three parts of his N-of-1 record compare movement, seated transportation and heart-rate response. Each adds a different piece to the same functional question.
Movement detail
Anatomy, Planes and Controlled Propulsion
Explore how linked joints, weight transfer and rolling support change the movement pathway through the body.
The injury context
The pelvis connects the legs and upper body
Troy's pelvic and hip history makes the way he moves important. The pelvis passes motion between the legs and trunk. During walking, support shifts from one leg to the other with every step.
The foot, knee, hip and pelvis work together. Changing how the foot meets the ground can change the movement Troy feels higher in that chain.
- Foot and ankleContact and redirection
- Knee and hipSupport and advance the limb
- Pelvis and SITransfer forces
- Trunk and spineStabilize and respond
The illustration follows movement from the ground through the foot and leg toward the pelvis and trunk. It explains the pathway; the sensor result appears below.
Movement happens in three directions
The body moves side to side, forward and backward, and in rotation. Walking and skating use all three, but with different timing and support.
Side to side · Frontal Plane
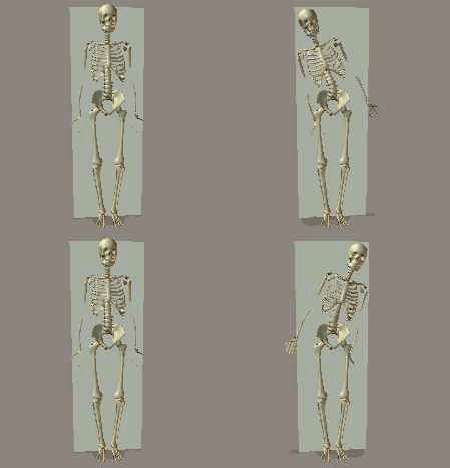
Forward and back · Sagittal Plane
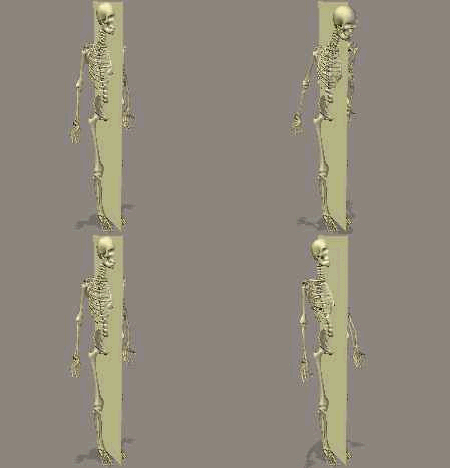
Rotation · Transverse Plane
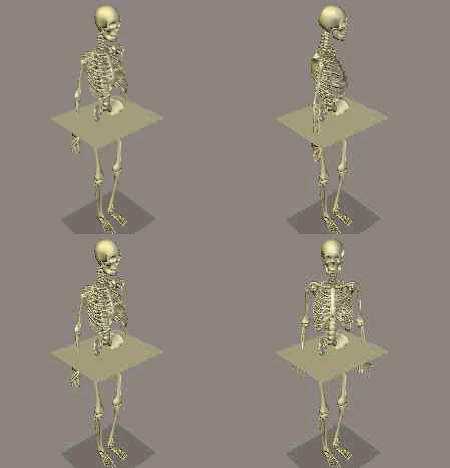
Walking steps. Controlled skating rolls.
Walking repeatedly puts a foot down, carries weight over it, then does the same on the other side. The body rises, falls and shifts with each step.
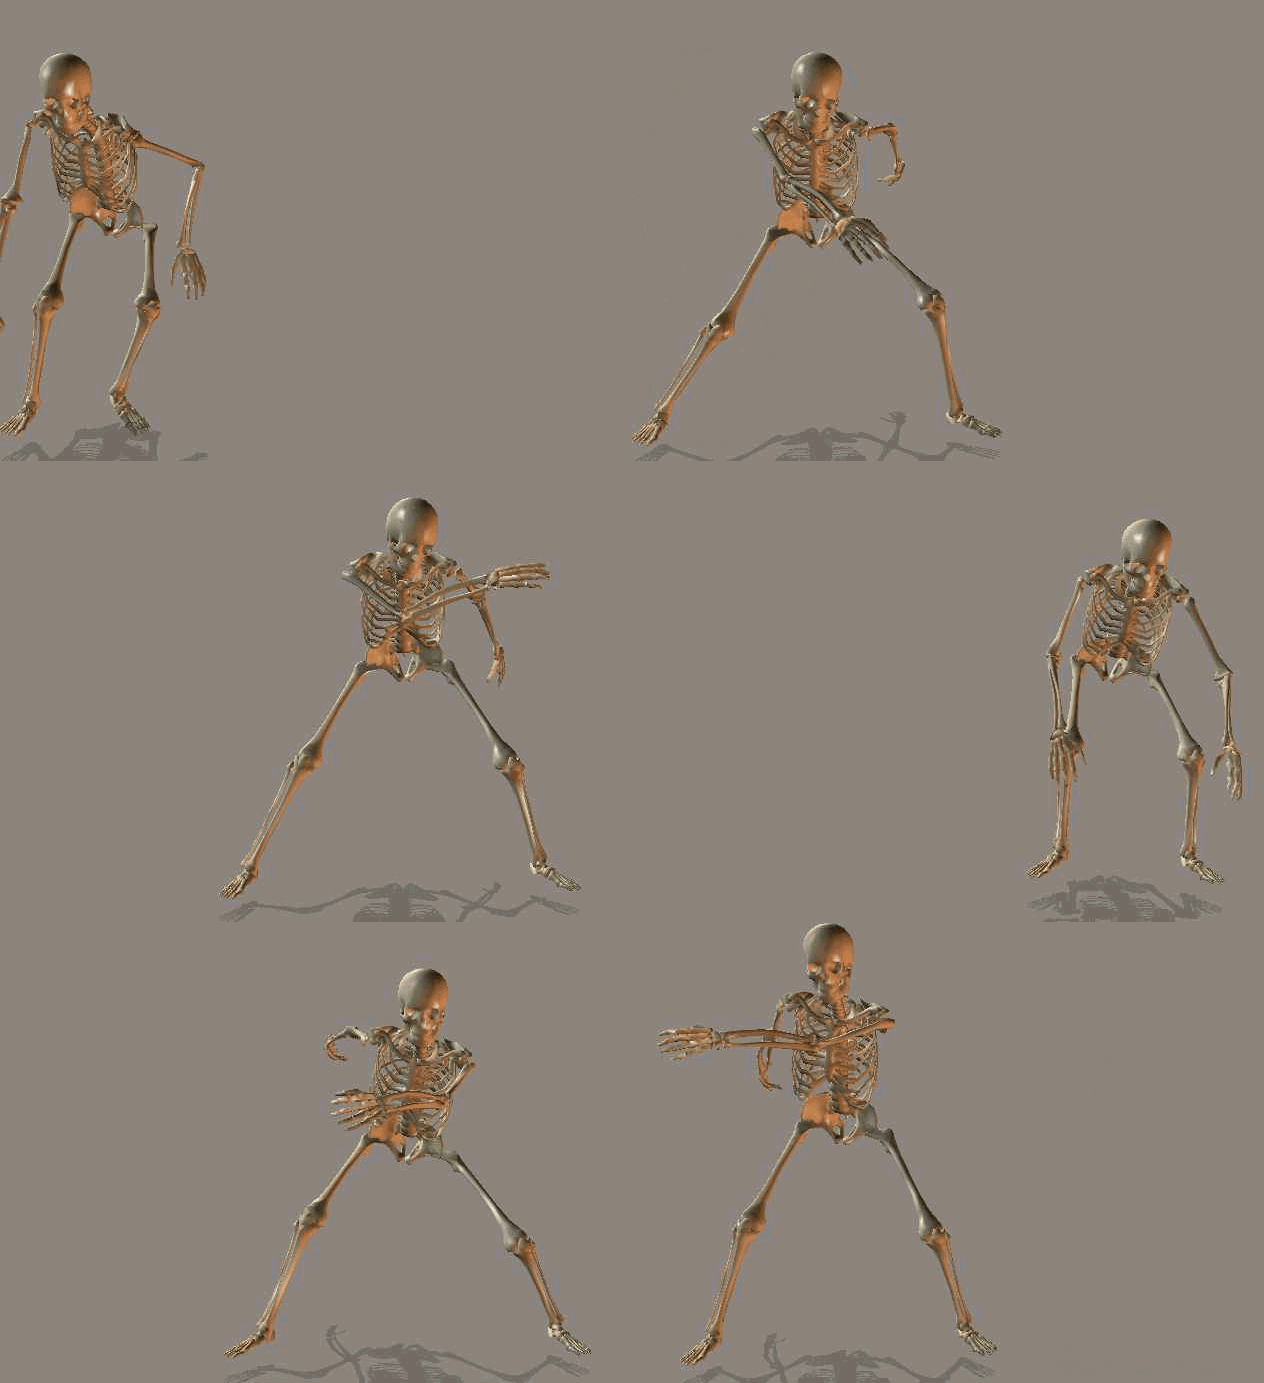
Controlled skating uses a sideways push followed by rolling and gliding. Troy can adjust the push, speed and glide. It still takes effort, but it is a different way to move.
Frontal View: Walking
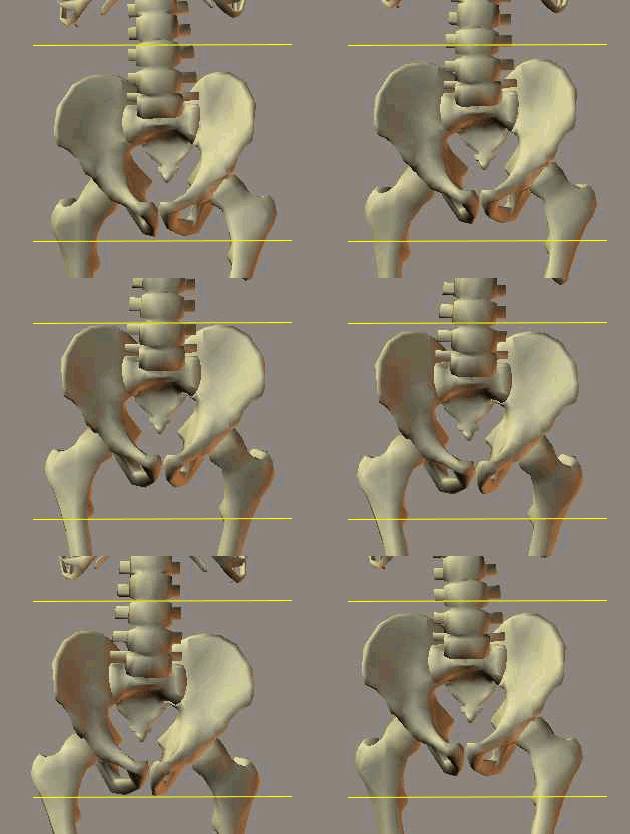
Frontal View: Skating
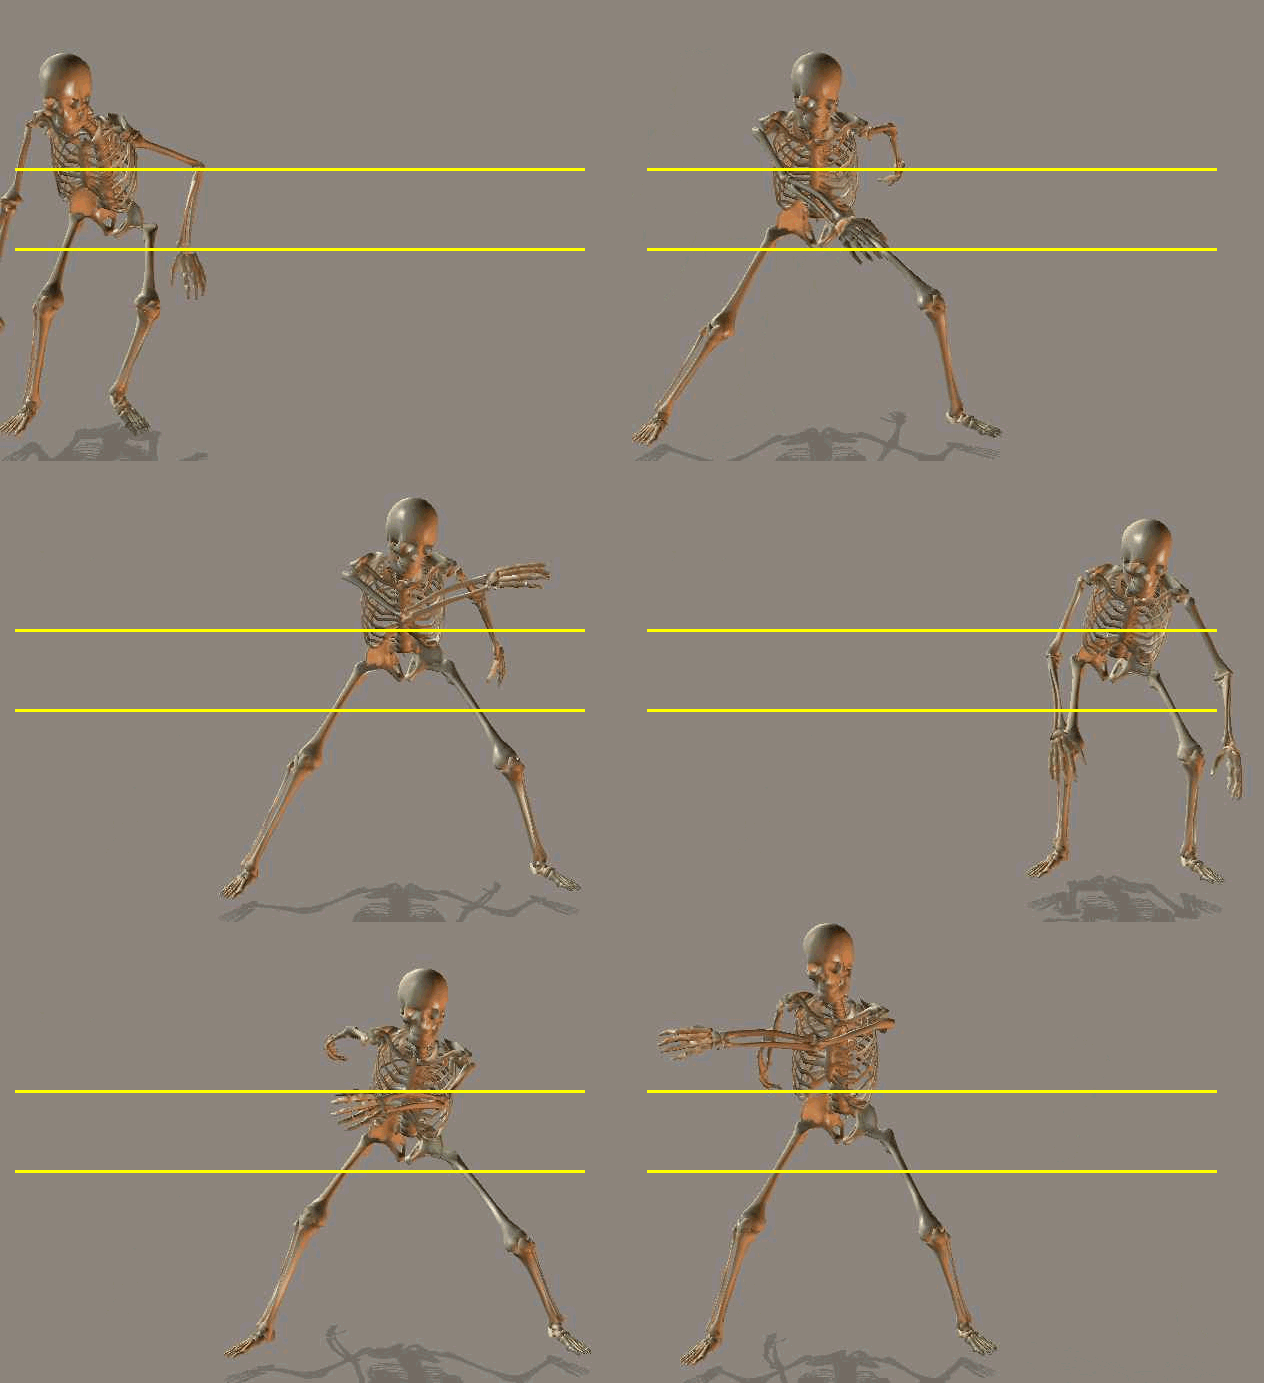
These animations show the movement patterns. The Walking vs Skating experiment measures what happened when Troy repeated them on the same days.
Experiment 1 · ambulation
Walking brought more repeated motion and less useful mobility
What Troy did: On 55 matched dates he skated through Hillsdale Mall, walked a short pain-limited residence hallway route, then skated again around his residence and PT route. What he experienced: walking brought escalating pelvic and hip pain; controlled rolling let him travel farther without the same reported disabling cycle.
What was measured: a chest sensor recorded repeated vertical motion. Walking measured about 0.138 g, versus 0.052 g during Mall skating; walking was higher on all 55 dates. The paired graph and useful-distance comparison are on the Walking vs Skating page. The fixed order shows a repeated relationship, without by itself proving that skating caused recovery.
Experiment 2 · transportation
A seated passenger still receives the vehicle's motion
What Troy experienced: the earlier taxi/sedan ParaTransit accommodation was workable for him. He reports greater discomfort with some later MV-operated bus, van and seating arrangements. What was measured: sensors recorded shaking, abrupt changes and repeated jolts during rides. Those motions can demand repeated stabilization around the pelvis, hips and spine; the measurements do not establish the force inside a particular joint.
What the evidence showed: the reviewed vehicle/body comparison found a difference in localized shaking, while other endpoints remained uncertain. May 23 was long and escalated late; corrected October 2 lasted 40:50 but was unusually persistent in abrupt motion. The body-coupling graph and full ride context live on Transportation Burden.
Experiment 3 · longitudinal physiology
Why does Troy's heart rate sometimes rise while he is sitting in a vehicle?
What was observed: WHOOP recorded heart rate across 161 ParaTransit sessions. Troy separately reports discomfort during some seated rides. The graph counts sessions that reached each heart-rate level: 33 activity averages reached at least 100 bpm; session peaks reached at least 100/130/140/150 bpm in 126/32/20/11 sessions. A peak does not show how long heart rate stayed elevated.
Activity-average heart rate · average across an activity, not a momentary peak
Average ≥100 bpm33
Session-maximum heart rate · highest recorded value in each session
Peak ≥100 bpm126
Peak ≥130 bpm32
Peak ≥140 bpm20
Peak ≥150 bpm11
Each bar counts sessions out of 161; the peak rows overlap and do not show how long heart rate stayed elevated. The 100 bpm reference is specific to Troy's investigation, not a clinical pain threshold.
Troy reports discomfort during some seated rides. WHOOP separately recorded heart rate across 161 ParaTransit sessions; an elevated peak does not identify its cause or duration.
Elevated heart rate during seated travel is consistent with a physiological burden response in this observed context. It does not identify pain as the cause of every episode. Read alongside Troy's reported discomfort and measured vehicle motion, it adds a third dimension to the N-of-1 record.
What the three experiments show together
Troy reports what hurts and what remains usable. Sensors separately record the movement and physiological conditions accompanying those experiences. Repeated walking comparisons, externally imposed ride motion and seated heart-rate observations together explain why an accommodation must be judged by how it works for this person in each setting.
Expanded anatomy, illustrations and movement references
Pelvic mechanics
Pelvic Structure
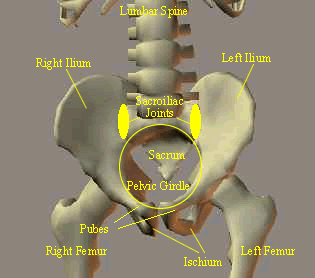
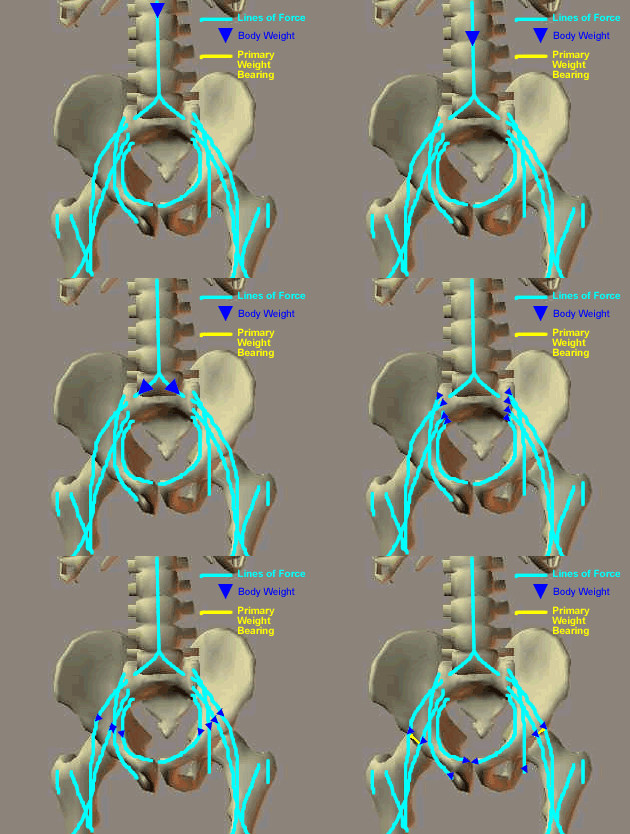
The pelvic girdle supports the head, arms, and trunk while transferring forces between the upper body and lower limbs. Walking coordinates rotation, tilt, and weight transfer through the pelvis as support moves from one leg to the other.
The SI joints are part of that transfer system. For a body with pelvic, SI-joint, and hip injury history, repeated movement through the same region can matter even when the external action looks ordinary.
This is why the comparison begins with function in this N-of-1 study rather than a claim that one locomotion mode is best for everyone.
Linked joints and force transfer
Pelvic Kinematic Chain
A kinematic chain produces movement through linked joints and their available degrees of freedom. A change at the foot, knee, hip, pelvis, or trunk can alter how the rest of the chain manages a movement.
Walking therefore cannot be reduced to heel contact alone. Support, muscular control, rotation, balance, and forward progression are coordinated through the whole musculoskeletal system.
Movement references include Norkin and Levangie, Hamill and Knutzen, Lee, Nordin and Frankel, and Schneck and Bronzino.
Planes of motion
Movement Happens in Three Dimensions
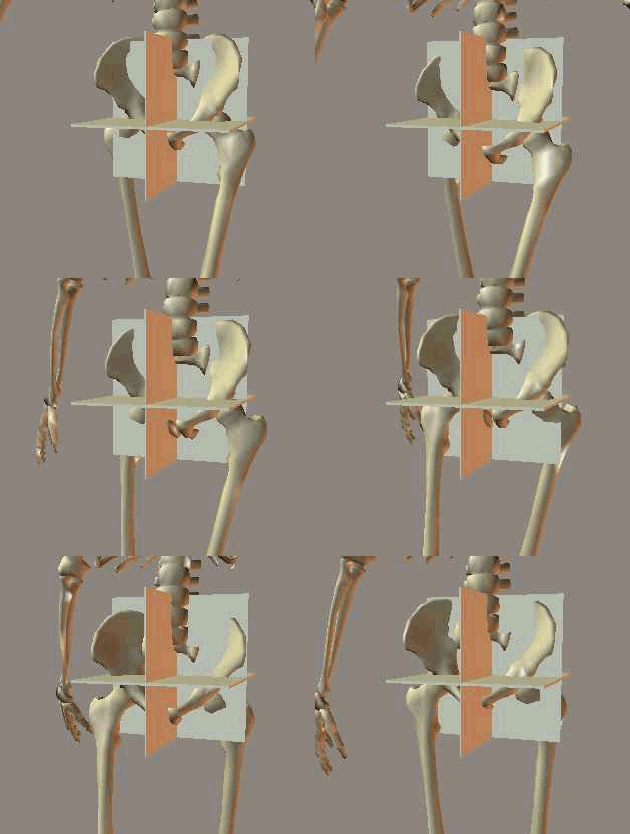
Walking and skating both involve frontal, sagittal, and transverse movement. The proportions, timing, support, and propulsion strategies differ.
Frontal Plane
Sagittal Plane
Transverse Plane
Walking mechanics
Walking Rebuilds Forward Motion Step by Step
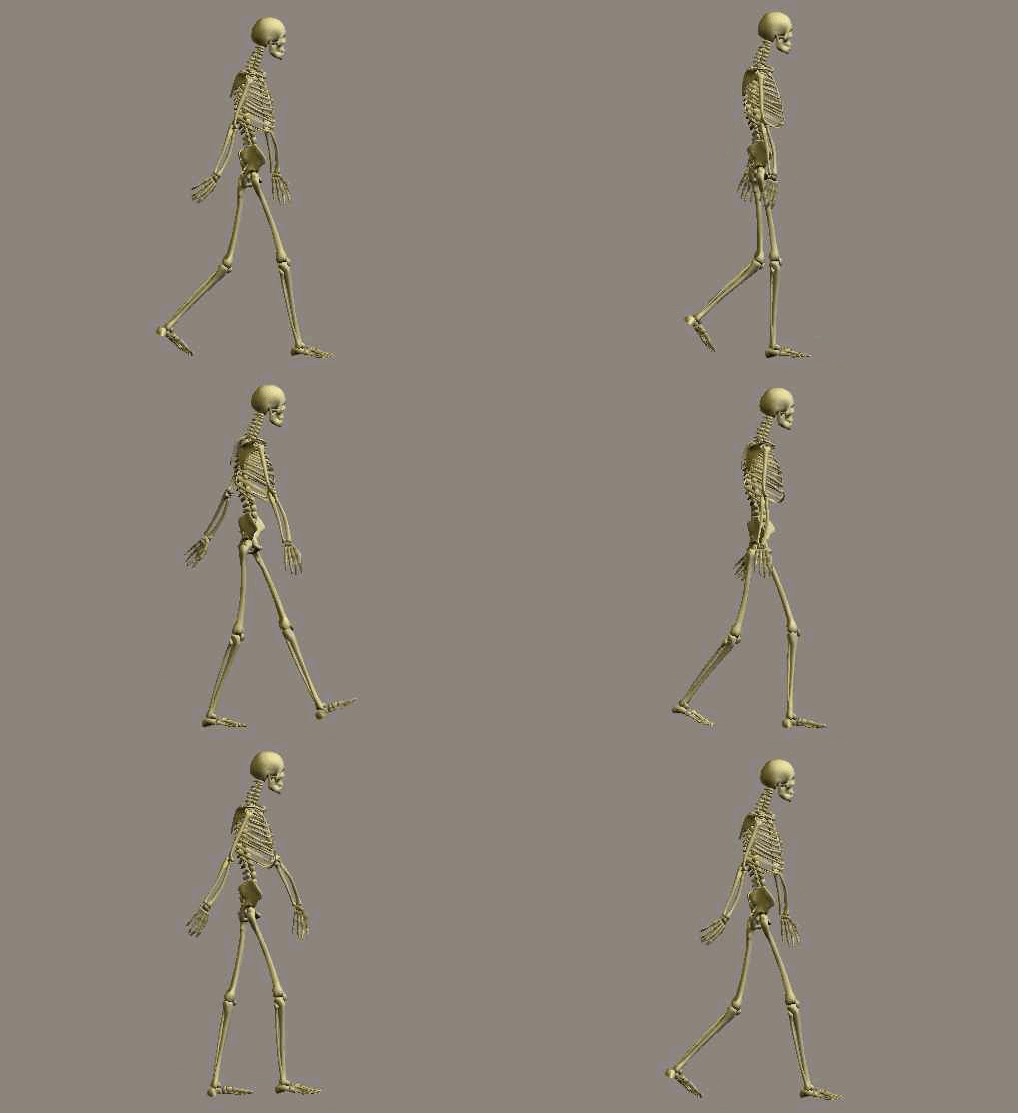
Walking alternates support from one leg to the other while the center of mass rises, falls, and shifts. Each cycle includes accepting weight, controlling the body over one limb, advancing the other limb, and preparing the next contact.
Analysis describes walking as a repeated braking-and-propulsion sequence. It identifies the recurring cycle of contact, support, redirection, and toe-off.
For this personal record, repeated walking can become burden-dense: the activity may end after little useful distance even though each individual step remains possible.
Visual comparison
Walking Load Path and Controlled Rolling
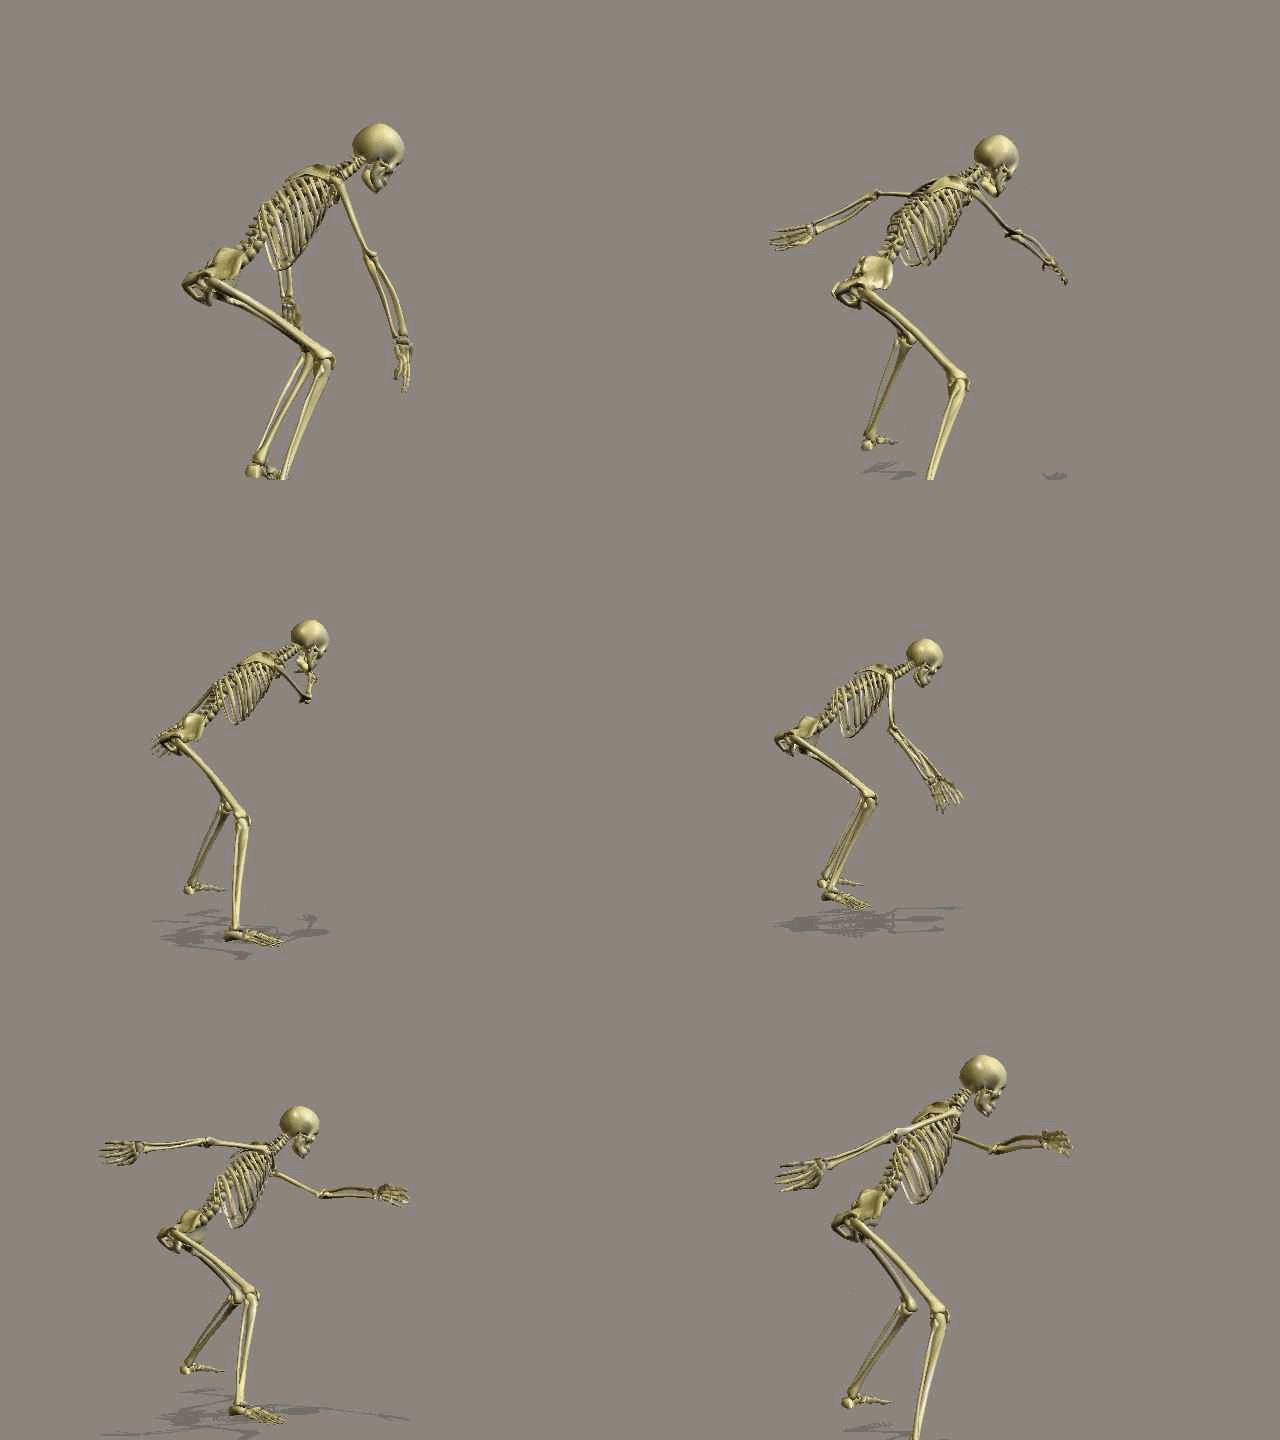
These diagrams illustrate different movement sequences.
Frontal View: Walking
Frontal View: Skating
Side View: Walking
Side View: Skating
Push, roll, glide
Controlled Propulsion and Double-Push Context
Inline-skating propulsion is not one fixed technique. A controlled stride can shift weight laterally, push through an edge, and use the resulting roll before the next propulsion cycle. Double-push techniques add another inward or outward propulsion phase within the stride.
It is the ability to regulate push size, edge, speed, posture, and glide so movement can be adapted to the environment and current capacity.
Supporting measurements and technical context
14.17× farther on skates. Median Mall distance 2.003 miles versus pain-limited Walking 0.141 miles. Mall farther on 55/55 matched dates.
The strongest measured result
MEASUREMENT · frozen same-day evidence
55 dates. One consistent functional result.
2.003 miles of controlled Mall skating versus 0.141 miles of pain-limited Walking: 14.17× farther by the ratio of medians, with Mall farther on 55/55 dates.
Walking and vigorous PT skating can have similar mechanical exposure per minute while producing radically different useful mobility.
Walking/PT A2 per self-propelled mile: 4.37× (paired-date 95% interval 3.92–4.87; 54 dates).
| Mode | Distance, self-propelled mi | A2/min, g²·s/min | A2/self-mile, g²·s/mi |
|---|---|---|---|
| Mall skating | 2.003 | 0.162 | 2.76 |
| Pain-limited Walking | 0.141 | 1.146 | 44.97 |
| PT skating | 1.809 | 1.113 | 9.95 |
Walking and PT rate intervals include zero; this is descriptive similarity, not an equivalence test. Mechanics use 55 Walking and 54 PT stages. Measurements are context, not pain scores.
Frozen measured series · TRANSPORT-BURDEN-01 V3
ParaTransit is an exposure, not just a route from A to B.
Transportation burden is not a single number. Ride duration, mechanical intensity, persistence, accumulation, and the trajectory within a ride each answer a different question.
Externally imposed mobility · ParaTransit
- Road → vehicle motion
- Seat and body contact
- Hip/pelvis/SI transmission is a mechanical hypothesis
- Measured RMS, jerk, shock and duration
- Measured physiology + separately observed pain context
- Separately observed pain and function
Longitudinal seated-transport context
Heart rate during transport has a different functional context from heart rate during vigorous skating.
161 sessions112 dates · 2025-01-10 → 2026-08-29
87 bpmmedian activity mean HR
33/161activity means ≥100 bpm
126 sessionssession maximum HR ≥100 bpm
32 sessionssession maximum HR ≥130 bpm
20 sessionssession maximum HR ≥140 bpm
11 sessionssession maximum HR ≥150 bpm
Vigorous skating: high HR can accompany intentional cardiovascular work → self-generated propulsion → useful mobility. Seated ParaTransit: high HR can occur during externally generated transportation, with no self-propelled locomotor work. These are distinct functional contexts; the summaries do not assume identical physiology.
Historically labeled “Horseback Riding”, these activities are governed as ParaTransit; unknown vehicle identities remain unknown.
FUNCTIONAL CONTEXT · LONGITUDINAL ACTIVITY HR
High HR means different things in different activities
These source-specific activity summaries provide context; they are not matched distributions.
FNS/SNS skating · self-propelled115 bpm1,165 HR-supported activity records
ParaTransit · externally transported87 bpm161 governed WHOOP sessions · 112 dates
Vigorous skating: high HR can accompany intentional cardiovascular work → self-generated propulsion → useful mobility.
Seated ParaTransit: I first noticed unexpectedly high heart rate while sitting in transportation, rather than while generating locomotor work. That observation motivated this transportation-burden analysis.
Activity mean HR reached ≥100 bpm in 33/161 sessions. Session maximum HR reached ≥100 bpm in 126, ≥130 bpm in 32, ≥140 bpm in 20, and ≥150 bpm in 11 sessions. Maxima do not show time above a threshold.
100 bpm is a subject-specific investigation reference, not a universal clinical pain threshold. HR does not itself measure pain. Function/pain, mechanics and physiology remain separate evidence tracks.
Enhancing governed charts…
59 measured rides · 3,888 ride-bound windows
Typical ride · median38.48 min
May 23 Bus · longest92.88 min
On May 23, RMS and jerk each exceeded their historical P75 for 62.88 minutes of window support. By the final portion, RMS was 90.8% higher than at the beginning. The detailed evidence shows when the elevated metrics overlapped.
Prospective evidence reinforces why duration alone is insufficient: an Oct. 2 ride of ordinary-range duration ranked near the historical upper tail for corrected jerk (duration P64.4; jerk P93.2).
Explore continuous transportation exposure → See the evidence summary
AI / ML · supporting evidence
Measured states can be distinguished and their next state predicted.
0.98Mall versus PT mechanical balanced accuracy, with triplets held together
5/5new dates reproduced the mechanical return direction
These models analyze the same N-of-1 observations. They support state distinction and prospective consistency; they do not measure pain.