Complete · frozen · N-of-1 evidence
Walking vs Controlled Skating
In Troy's injury context, Walking is pain-limited. Controlled Mall skating supports useful mobility with lower measured acceleration. Reported pain, measured mechanics and distance each tell a different part of that story.
The experiment
55 dates. Three stages. One subject.
Mall Skate → Pain-Limited Walking → PT Skate. The completed experiment compared these stages on the same 55 matched dates. This repeated, fixed-order protocol is frozen; it is not waiting for more triplets. Same-day comparisons reduce differences in day-to-day context, while the fixed order limits causal interpretation.
Pain and function: the reported distinction
Troy reports that Walking initiates a disabling pelvic/hip pain cycle. Controlled Mall skating does not initiate that same cycle, and sustained movement feels beneficial to his hip. Walking was stopped by pain in the protocol; skating supported continued movement.
These are reports of experience and function. The chest accelerometer measured motion independently. It did not measure pain, synovial-fluid circulation or healing. The functional question is how movement can be sustained, alongside the mechanical conditions measured during it.
Measured mechanics
Lower acceleration during controlled Mall skating
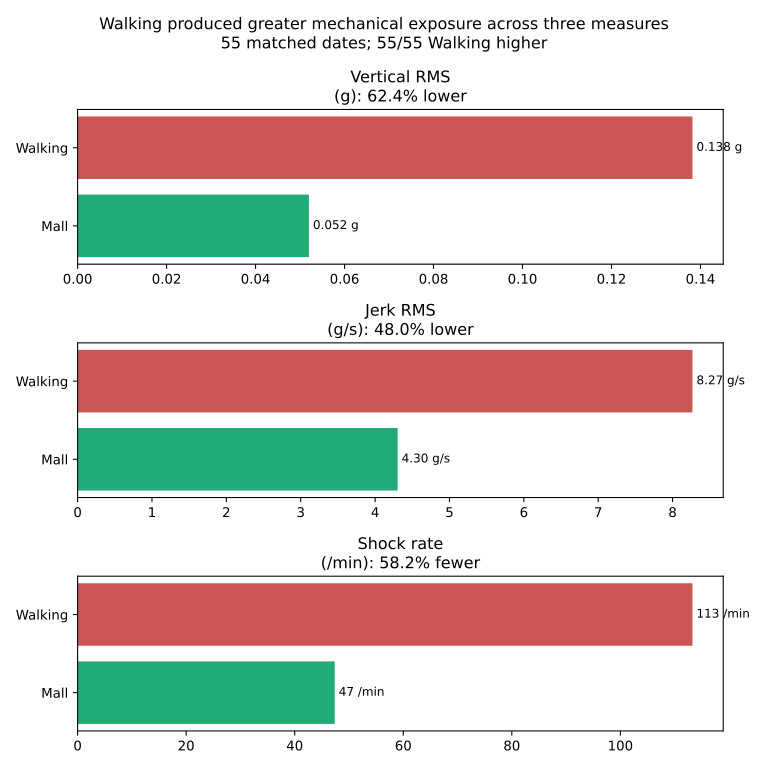
62.4% lower Mall vertical RMS by the published mode medians.
Each panel uses its own physical scale; bar lengths cannot be compared across panels.
Walking higher on 55/55 matched dates. Mall 0.052 g; Walking 0.138 g. Mode medians, chest accelerometer.
Paired Walking − Mall difference: 95% bootstrap interval 0.08276–0.08633 g. This interval describes paired differences, not uncertainty around each median. Acceleration is not pain.
Vertical RMS describes the overall magnitude of repeated vertical acceleration. Lower RMS identifies a different external mechanical environment; it does not by itself establish the cause of pain or prescribe a treatment.
Reproducibility within this person
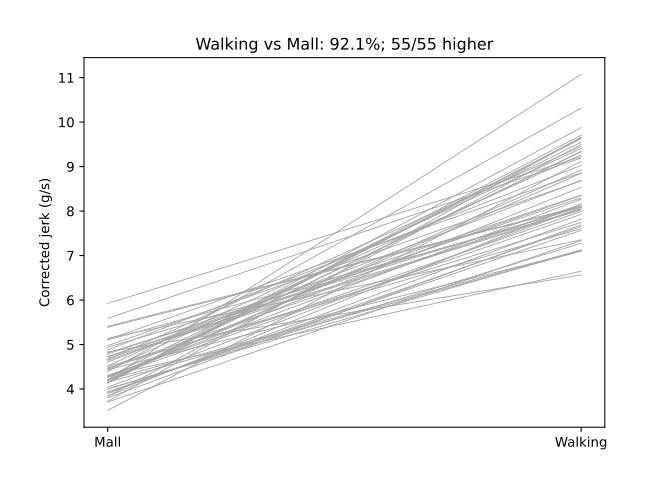
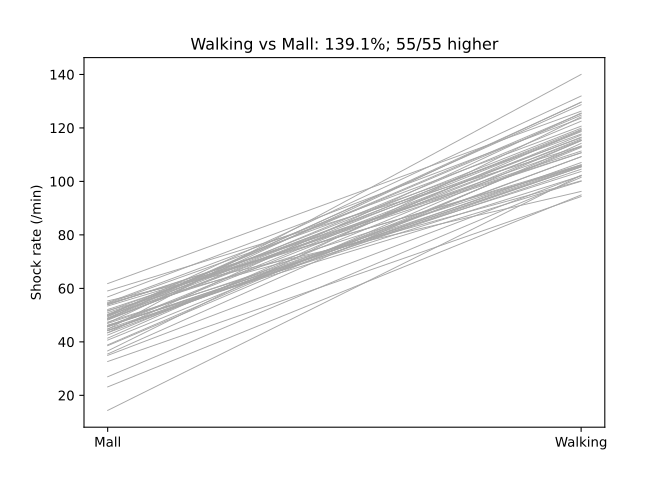
The direction repeated on every matched date
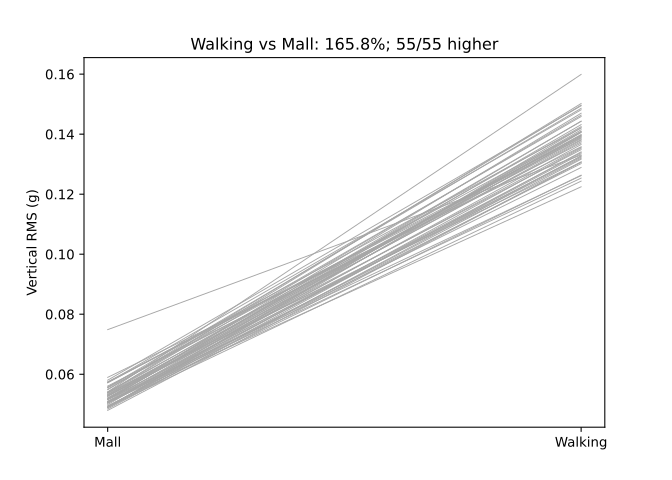
Repeated direction is stronger evidence of a stable within-person distinction than a single striking session. It does not establish that every person's response will be the same, or isolate skating from all features of this protocol.
Useful mobility
Read exposure alongside what movement achieved
Mall 2.003 miles; Walking 0.141 miles. These medians give 14.17× farther during Mall skating across 55 matched dates.
Each panel uses its own physical scale; bar lengths cannot be compared across panels.
Each panel uses its own physical scale; bar lengths cannot be compared across panels.
Each panel uses its own physical scale; bar lengths cannot be compared across panels.
Walking and vigorous PT skating can have comparable exposure per minute while producing very different useful mobility. Squared-acceleration exposure emphasizes larger accelerations; each panel starts at zero.
Walking/PT squared-acceleration exposure per self-propelled mile: 4.37× (95% paired-date interval 3.92–4.87; 54 dates). Per-minute difference intervals include zero; this is descriptive similarity, not an equivalence test.
Functional distance: 55 dates. Native mechanics: 55 Mall/Walking, 54 PT; one PT recording unavailable. Native exposure is divided by the distance of the same stage; missing exposure is not extrapolated.
Distance demonstrates useful mobility; it is not the entire conclusion. The central comparison combines reported pain limitation, independently measured mechanics and functional output. Vigorous PT skating also shows why cardiovascular work and mechanical exposure must be interpreted in their activity context.
What this does not prove
This is repeated N-of-1 evidence with fixed stage order, not a population-wide causal claim. Chest motion does not directly measure internal SI-joint force, tissue stress or pain. Historical explanations about joint lubrication are context, not findings measured by this telemetry.
Explore the full analysis
The Observatory contains the reviewed headline comparisons and uncertainty. The expandable supplement below retains additional tables and figures until their complete public Observatory presentation is available.
Additional results, technical tables and historical context
Question
Why use skates instead of pain-limited Walking?
Longitudinal WHOOP/Strava activity first identified a recurring real-world mobility pattern. The frozen same-day protocol then compared controlled Mall No-Steps skating, pain-limited Walking, and PT skating on the same dates.
Evidence status: MEASURED means governed analysis; DOCUMENTED means a primary record; REPORTED means Troy's account; INTERPRETATION means an explanation drawn from the evidence.
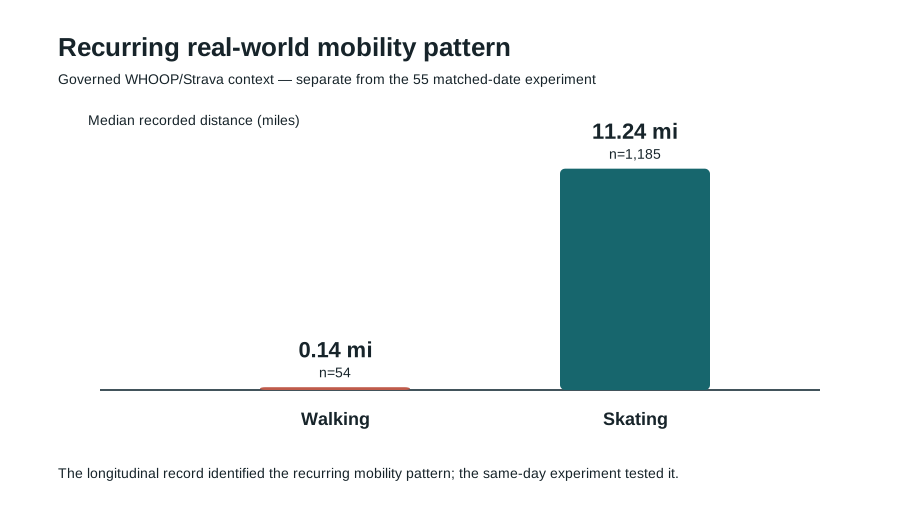
Functional result
More useful mobility
These function results are retained exactly from the frozen protocol.
Corrected mechanical results
Lower measured mechanical exposure during Mall skating
How to read these measurements
A mechanical profile, not one number
HOW MUCH?
RMS
Overall intensity of dynamic acceleration.
HOW ABRUPT?
Jerk
How rapidly acceleration changes.
HOW OFTEN?
Shocks / disturbance clusters
How frequently disturbances occur or arrive in repeated bursts.
HOW PERSISTENT?
Cluster time
How much of a journey is occupied by repeated disturbance periods.
HOW STRONG?
P95
The stronger end of the measured exposure.
BODY RESPONSE
HR / HRV
Cardiovascular and autonomic response.
Function · intensity · exposure per self-propelled mile
What did the measured movement produce?
FUNCTION / PAIN
Observed function
Walking was pain-limited in the governed fixed-order protocol; distance achieved and termination describe function. Mall and PT skating supported continued useful mobility.
MECHANICS
Observed motion
RMS, corrected jerk, detected shock rate, recording duration and native A2/J2 exposure retain separate units and denominators.
PHYSIOLOGY
Observed physiology
Session HR/HRV and event response are separate episodic measurements. Overnight WHOOP recovery HRV is longitudinal context, not session HRV.
Independent measurements are read alongside observed or reported function and pain. RMS, jerk, shock, HR and HRV do not directly measure pain.
Mobility return for exposure · frozen CALC-MOB-01 V4
Similar exposure per minute. Very different mobility.
Walking was stopped by pain in this governed protocol. PT skating remained physically vigorous while supporting much farther travel. Read left to right: functional distance, observed exposure rate, then observed exposure per useful mile.
Each panel uses its own physical scale; bar lengths cannot be compared across panels.
Each panel uses its own physical scale; bar lengths cannot be compared across panels.
Each panel uses its own physical scale; bar lengths cannot be compared across panels.
Download the three-panel figure (SVG) · PNG
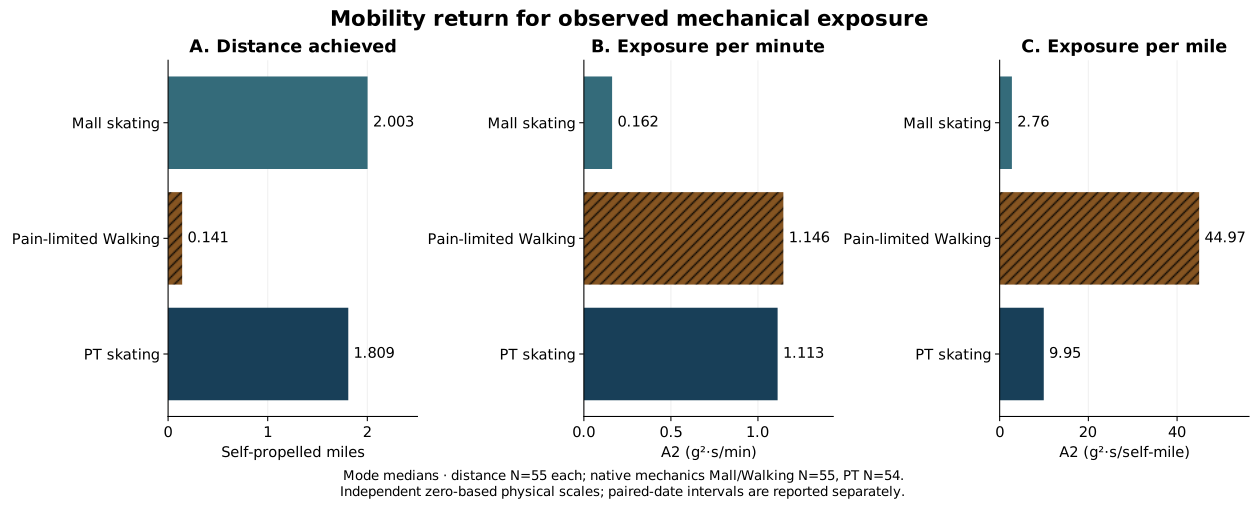
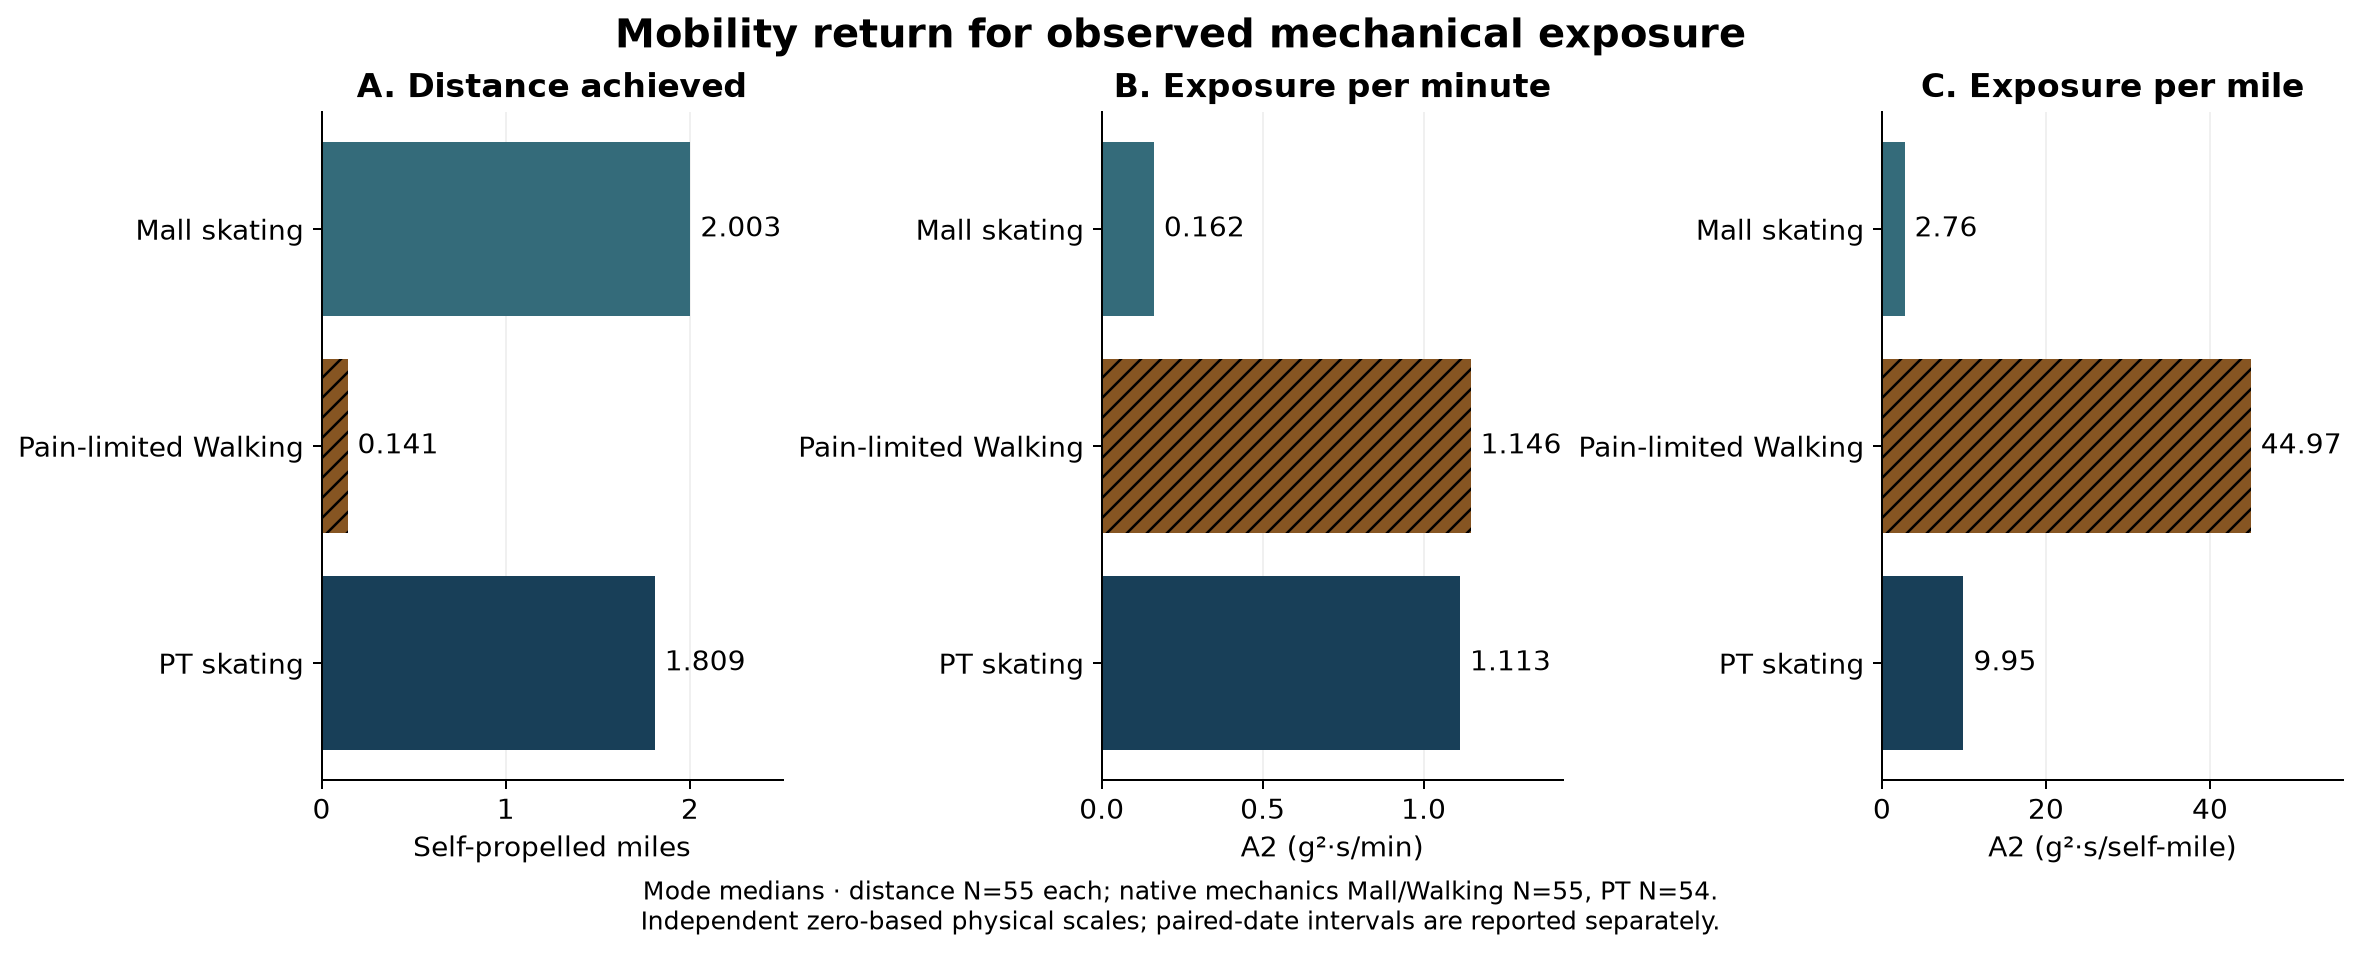
Each panel starts at zero and uses its own physical scale. A2 is squared-acceleration exposure, not RMS or a unitless burden score. Separate mode medians are shown; paired-date ratios below are not ratios of those medians.
Functional distances: 55 stages per condition. Native CALC mechanics: Mall 55, Walking 55, PT 54; one PT ACC recording is unavailable. Native recording exposure is divided by the governed distance of that same stage; no missing exposure is extrapolated.
Read the separate J2 comparison and physical units
Each panel uses its own physical scale; bar lengths cannot be compared across panels.
Each panel uses its own physical scale; bar lengths cannot be compared across panels.
J2 integrates squared raw derivative jerk. It is distinct from the corrected jerk RMS headline; the quantities are never pooled.
The paired comparison asks what happened on the same dates.
Each point is the median of date-wise Walking/skating exposure ratios per self-mile. Lines are frozen paired-date bootstrap 95% intervals. The dashed line means equal per-mile exposure. A2 and J2 are related mechanical descriptors, not independent replications.
| Comparison | Metric | Paired dates | Median ratio | 95% interval |
|---|---|---|---|---|
| Mall skating comparator | A2/self-mile | 55 | 15.6379 | 15.1200–16.4287 |
| PT skating comparator | A2/self-mile | 54 | 4.3704 | 3.9176–4.8736 |
| Mall skating comparator | J2/self-mile | 55 | 9.5988 | 8.7955–10.2520 |
| PT skating comparator | J2/self-mile | 54 | 4.0829 | 3.6819–4.3767 |
Why “similar per minute” is not an equivalence claim
The Walking minus PT A2/min and J2/min intervals both include zero. This is descriptive similarity; no equivalence margin was specified. Their per-mile differences remain substantial because useful distance differs.
| Metric | N | Median difference | 95% interval | Holm p |
|---|---|---|---|---|
| A2/min | 54 | 0.0361 | -0.0288–0.0708 | 0.4863 |
| J2/min | 54 | -65.0130 | -155.6167–44.9697 | 0.4863 |
Native recording exposure is divided by the governed distance of the same stage. Recording and stage boundaries differ; no missing exposure is extrapolated. These are CALC derivative metrics, distinct from the corrected jerk headline definition.
ENT-CX describes a complementary dimension: Walking's motion was more temporally ordered by permutation entropy despite its higher RMS and jerk. This reuses the same observations; it does not establish benefit, harm or pain from entropy.
Supporting fixed-protocol AI
The measured stages also separated in held-out models.
DISTINGUISH
0.98Mall versus PT mechanical balanced accuracy under grouped validation.
PREDICT
0.979 / 0.839 / 0.972Historical → five-date mechanical / physiology / joint next-state R².
REMEMBER
+0.4012 / +0.4729R² uplift when prior Walking burden joins the current state; ten held-out triplets.
RECOVER
p=0.00999Fixed-protocol mechanical versus physiological recovery-lag permutation; ten paired triplets.
GENERALIZE
5/5Prospective five-date mechanical return direction; no overlap with training dates.
The five-date block is prospective to the historical training block, but it is the same person and fixed sequence. Prediction and recovery timing do not establish a treatment effect.
Inspect model scope and source hashes
N-of-1 repeated observations; models reuse the same underlying protocol and are method convergence rather than independent replication. R² is held-out fit, not a clinical outcome. Pain is first-person evidence. Grouped classification of protocol-linked pain-context labels; PC-01 finds pain prediction within a fixed mode/context not identifiable. This is not pain detection.
| Artifact | SHA-256 |
|---|---|
| analysis/offline_rl/outputs/FIVE_DAY_REPLICATION_ANALYSIS.json | 67a31a8da33cccc57ecce8645542c3d1d3406fe0937764e6bb7b3121b9ef758c |
| analysis/triplet_mobility_discrimination/validation_phase2/MALL_VS_PT_SKATING_RESULTS.json | 0558391cbc181ab7faa6f09749278a8ae54b1af9b9320f80cc700d80620398f3 |
| analysis/integrated_mobility_evidence/pc01/PC01_LABEL_IDENTIFIABILITY.json | ca1c2fb18126de295a0de53a4251b2d5fef24942d60c535fa71f007d99c88959 |
| analysis/offline_rl/outputs/phase6/PHASE6_SUMMARY.json | 3f244f01614a07145a19473a0be2582e5f86253e668b1770be6546c23d722639 |
| analysis/offline_rl/outputs/phase7/PHASE7_SUMMARY.json | 2df2d87cc490f01db592f456a78d6c805123d20a886d0fd4fe733afb5be397ac |
| analysis/offline_rl/outputs/phase8/PHASE8_SUMMARY.json | 40129f4ad3159c50446131bd04e37cac14af03a0604d7ca15adf279fcd4ca490 |
| analysis/offline_rl/outputs/phase6/RL6_11_UNSUPERVISED_30S.json | 9b954f9d722a6c6fb691c3bd72b7c3de91a068fef0b3ef24d89aa700d56b329d |
| analysis/offline_rl/outputs/phase6/RL6_11_UNSUPERVISED_60S.json | fc4f126902aabfc75d908689a71b5d7596070a24401b586ef9be94ed5a5e0c6e |
Label-blind clusters had near-zero adjusted Rand agreement with revealed pain-context labels. PC-01 also found within-context pain prediction unidentifiable. Governed RAG retrieves source-linked evidence; retrieval is not a new scientific replication.
CALC-MOB-01 · verified protocol-stage analysis
Mechanical exposure per useful mile
The same-day experiment was also analyzed with calculus. It asks three different questions: how much exposure accumulated in a native ACC recording, how quickly it accumulated per minute, and how much observed exposure accompanied each self-propelled mile of the same protocol stage. These are mechanical descriptors, not pain scores or a ranking of clinical benefit.
Mall skating and Walking each have 55 eligible stages; PT skating has 54. The PT stage on 2026-08-05 has no supported native ACC exposure and was excluded. Matched Walking/Mall comparisons use 55 dates; Walking/PT comparisons use 54.
Intensity context. Median vertical RMS is 0.0519942 g for Mall, 0.138206 g for Walking, and 0.136203 g for PT. V4 raw jerk RMS is 2.54251, 5.09961, and 5.22408 g/s, respectively. V4 raw jerk uses a different signal definition from the corrected jerk headline above.
Raw dose: total observed exposure
The raw integrals accumulate over each native ACC recording. Walking's recording is much shorter, so it does not need to have the largest total dose to have the largest cost per useful mile.
| Exposure | Mall skating | Walking | PT skating |
|---|---|---|---|
| A1 — Accumulated absolute acceleration exposure (g·s) | 78.4847 | 32.4128 | 101.091 |
| A2 — Squared-acceleration exposure (g²·s) | 5.47428 | 6.08985 | 17.949 |
| J1 — Accumulated absolute jerk exposure (g) | 3386.62 | 1025.44 | 3332.99 |
| J2 — Squared-jerk exposure (g²/s) | 12880.1 | 8398.84 | 26269.9 |
Per minute: exposure rate
Dividing raw exposure by elapsed native recording minutes shows movement intensity over time. Squared-acceleration and squared-jerk rates for Walking and PT skating are similar in this protocol; PT remains mechanically vigorous.
| Exposure | Mall skating | Walking | PT skating |
|---|---|---|---|
| A1 — Accumulated absolute acceleration exposure (g·s/min) | 2.35122 | 6.00469 | 6.20807 |
| A2 — Squared-acceleration exposure (g²·s/min) | 0.162204 | 1.14607 | 1.11309 |
| J1 — Accumulated absolute jerk exposure (g/min) | 103.132 | 191.797 | 201.646 |
| J2 — Squared-jerk exposure (g²/s/min) | 387.86 | 1560.36 | 1637.47 |
Per self-propelled mile: functional mechanical cost
Observed native exposure is divided by governed distance from the same stage. These medians are stage-level values. Passenger or vehicle miles are never used as the denominator.
| Exposure | Mall skating | Walking | PT skating |
|---|---|---|---|
| A1 — Accumulated absolute acceleration exposure (g·s/self-mile) | 39.476 | 233.316 | 55.0961 |
| A2 — Squared-acceleration exposure (g²·s/self-mile) | 2.76144 | 44.9736 | 9.94596 |
| J1 — Accumulated absolute jerk exposure (g/self-mile) | 1712.92 | 7500.78 | 1828.16 |
| J2 — Squared-jerk exposure (g²/s/self-mile) | 6549.26 | 59081.6 | 14498.8 |
A1 is accumulated absolute acceleration; A2 squares acceleration, emphasizing larger accelerations. Jerk is the governed forward difference of acceleration. J1 accumulates absolute jerk; J2 squares jerk, emphasizing larger abrupt changes.
Calculus definitions and units
A1 = ∫|a(t)|dt (g·s); A2 = ∫a(t)²dt (g²·s); j(t) = da/dt as a governed forward difference; J1 = ∫|j(t)|dt (g); J2 = ∫j(t)²dt (g²/s). Per-minute and per-self-mile values divide these observed exposures by elapsed native minutes or same-stage governed miles, respectively.
Matched-date cost ratios
Each ratio below is the median of date-wise Walking/skating ratios, with a paired-date bootstrap 95% confidence interval. It is not a ratio of the mode medians in the tables.
PT skating shows why intensity and output must be read together. Walking and PT have A2 rates of 1.14607 and 1.11309 g²·s/min, and J2 rates of 1560.36 and 1637.47 g²/s/min. Yet median stage distance is 0.1413 mile for Walking and 1.80894 miles for PT. The paired-date Walking/PT ratios are 4.3704× for A2 and 4.0829× for J2 per self-mile. Mechanical intensity, accumulated dose, and functional mechanical cost describe different dimensions.
Median native ACC durations are 2026.8, 322.735, and 999.265 seconds for Mall, Walking, and PT; median governed stage durations are 2045, 334, and 1020 seconds. Their boundaries differ. No numerator was scaled to fill a stage, and the duration comparison does not prove exact temporal alignment.
Motion organization. Walking permutation entropy was lower than Mall on all 55 matched dates while Walking had higher RMS and jerk. Entropy describes organization of motion. Lower is not a harm score; higher is not a benefit score.
Sensitivity. All 12 per-self-mile contrast directions persisted when native recording and stage durations were restricted to within ±5%, ±10%, and ±20%. These subsets do not replace the primary eligible population.
Provenance: reviewed CALC-MOB-01 public values from run 20260929T-CALC-MOB-01-V4-STAGE-NORM (COMPLETE_VERIFIED). The scientific calculations remain in the FSICSS evidence platform; this page renders its reviewed output.
Paired consistency
Every matched date showed the same Walking-vs-Mall direction
Technical detail
Upper tails, physiology, and the PT phenotype
The difference extends into the stronger end of the mechanical exposure, not only the overall average. Walking magnitude P95 was 0.431 g versus 0.205 g for Mall skating: 110.43% higher on all 55 matched dates, with a paired-bootstrap median-difference interval of 0.21945–0.24053 g. Jerk P95 and P99 were also 133.36% and 159.73% higher.
Complementary physiology. In the cohort-stratified session review, higher vertical RMS covaried with higher mean HR within Mall (Spearman ρ=0.43; bootstrap interval 0.19–0.62; N=55) and PT skating (ρ=0.50; 0.26–0.69; N=54). These are session-level within-condition associations; HR and HRV provide complementary activity context.
PT is a distinct vigorous skating phenotype. Mall and PT skating are not mechanically interchangeable: PT timed comparisons use N=54 because one PT stage lacks native ACC. Walking and PT can have similar vertical RMS while differing in movement organization and functional output.
Repeated N-of-1 results describe this governed protocol. Open technical provenance in Evidence Observatory.
Proposed portable accommodation
Recognition should travel with the person
Current documented record: accommodations and certifications are setting-specific. Proposed portable standard: a state driver's-license or identification notation could verify an individually established non-standard mobility aid, so that the same functional need need not be re-established institution by institution.
Inline skates are the demonstrated use case. The proposed framework is function-first and can extend to other individually established non-standard mobility technologies, including exoskeletons.