CONTINUOUS EXPOSURE · FROZEN DESCRIPTIVE EVIDENCE

Transportation Burden

Duration tells only part of the story. Follow measured intensity, persistence, accumulation and the trajectory within each ride. Different prolonged rides can have different exposure patterns.

Current transportation evidence · N-of-1

What changed, and why review is needed now

Troy reports that private taxi/sedan ParaTransit was his longstanding practical accommodation through January 2025. Service then shifted to MV-operated configurations. He reports new pain and discomfort with bus, van, back-seat and shared rides. This does not establish that every ride in those vehicles is harmful.

On one recent PT trip, he reports pickup about 1.5 hours beyond the expected 20-minute window; after additional passenger pickups and routing, he arrived about 1.5 hours after the approximately 9:00 scheduled arrival. A separate prolonged delay prevented his PCA from participating at PT. Waiting and lateness are service problems. Once aboard, added routing and time can extend measured in-vehicle exposure. Waiting outside the vehicle is not measured in-vehicle exposure.

What the measurements mean

Vertical RMS
Magnitude of repeated acceleration.
Corrected jerk
Abrupt changes in acceleration.
Shock rate
Frequency of detected impact-like events.
Duration / persistence
How long exposure continues.
HR / HRV
Separate physiological context.

These measurements characterize external mechanical and physiological conditions. They do not directly measure SI-joint force, tissue stress, or pain. Cumulative exposure separately describes how repeated exposure builds over observed time.

May 23 was a prolonged ride with a late sustained mechanical episode and a later physiological response. Corrected October 2 lasted 40:50: ordinary-range duration with unusually persistent corrected jerk and comparatively ordinary mean HR. Its status is operator-confirmed, Strava corroboration pending. Neither sequence alone establishes causation.

Administrative question: What vehicle, seating, routing, pickup/arrival and reasonable-modification practices can provide required service while minimizing avoidable disability-related burden? Immediate DOJ/DOT/FTA and provider review can proceed now, independently of the longer-term proposed NSMA pilot.

Related airline recognition chronology

Across airlines: The October 2025 renewed federal TRO papers alleged that United had accepted the mobility aid on a September business trip and outbound Virginia travel, but denied the scheduled return accommodation; the filing stated that Troy rebooked on American Airlines. This is an alleged chronology, not an adjudicated finding or proof of American’s accommodation outcome.

Airline record context

Frozen measured series · TRANSPORT-BURDEN-01 V3

ParaTransit is an exposure, not just a route from A to B.

Transportation burden is not a single number. Ride duration, mechanical intensity, persistence, accumulation, and the trajectory within a ride each answer a different question.

May 23 sequence Evidence and methods Transportation calculus

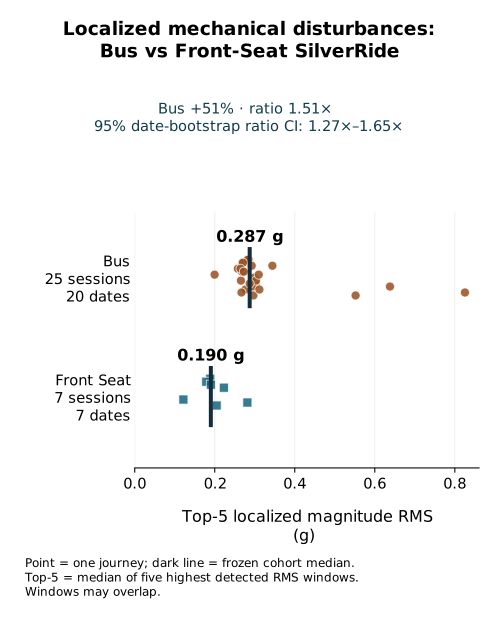
Frozen individual Bus and governed SilverRide Front Seat journeys, with cohort medians for localized magnitude RMS
Vehicle/body coupling: localized magnitude differs across these reviewed cohorts. Whole-record RMS and shock-rate intervals cross one; this does not establish a causal vehicle or seat effect. Explore the governed comparison.
Explore vehicle, seat, heart-rate and pain context

Body coupling · descriptive context

Vehicle motion reaches a seated body through contact with the vehicle.

Corrected chest-sensor RMS, jerk, shock and HR describe observed exposure. The sensor does not localize force to the pelvis, hip or SI joint. Duration and the rider’s independently reported pain/functional experience complete a different part of the evidence chain.

Frozen corrected-timebase ParaTransit rides, medians within each governed vehicle cohort
VehicleRides / datesDuration minVertical RMS gJerk g/sShock /minMedian HR bpm
Bus21 / 1741.80.1034.24102.976.9
Sedan/Taxi24 / 1737.00.0591.7988.992.4
SilverRide8 / 840.80.0591.9791.993.4
Van6 / 640.40.0632.90121.782.3

Each column has its own unit. These are repeated rides of one person, not a randomized vehicle comparison. Seat is unknown for most V3 rides and is not inferred. First-person labels were recorded for separate, sparse observations; they are not derived from these 59 ride metrics.

Separate governed first-person pain observations
Vehicle contextPain-labeled observations
Bus4
Van2
Sedan/Taxi4

Frozen SURF-TRANS-02 V8 · separate localized disturbance population

Bus versus governed SilverRide Front Seat

Frozen corrected 200 Hz Bus–Front medians and median-ratio bootstrap intervals
Metric / unitBus medianFront medianBus/Front ratio [95% interval]
Whole-record vertical RMS (g)0.1800.1171.547× [0.785, 1.671]
Corrected jerk RMS (g/s)5.2022.6751.944× [1.531, 2.400]
Detected shock rate (count/min)105.53592.5621.140× [0.870, 1.327]
Mechanical-disturbance clusters (clusters/min)20.2667.9012.565× [1.314, 3.238]

Frozen 5000 within-cohort session-resampled median-ratio bootstrap draws, seed 2002026. Not a date-block bootstrap; repeated-date dependence limits inference. Whole-record vertical RMS and detected shock-rate intervals cross one; these counter-results are retained. Corrected jerk and disturbance-cluster intervals are separate endpoints, not independent replications.

Corrected freeze projection

Bus and Front Seat: frozen estimates and date-bootstrap intervals
MetricBusFront SeatContrast and 95% interval
Top-5 localized magnitude RMS, g0.2870.1901.51× [1.27, 1.65]; difference 0.0971 g [0.0596, 0.1161]
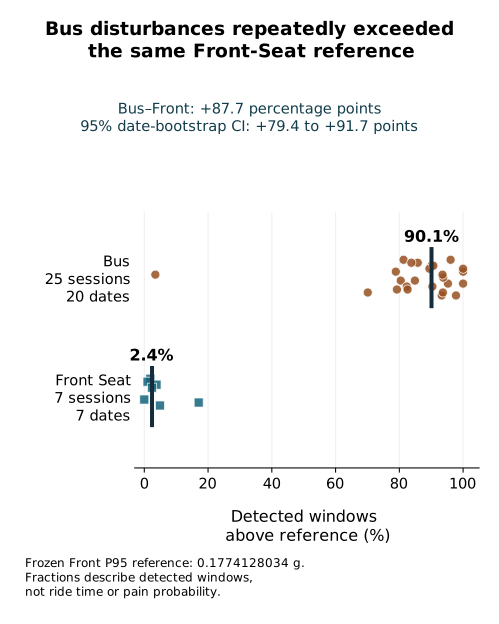
Detected windows above fixed Front P95, %90.12.4+87.67 percentage points [79.42, 91.65]
Frozen individual Bus and Front Seat journeys and cohort median localized magnitude RMS
Individual journeys behind the frozen comparison.
Frozen detected-window exceedance of the same Front Seat reference
Disturbance fractions describe detected windows, not ride time or pain probability.

Bus: 25 sessions / 20 dates; Front: 7 sessions / 7 dates. Bootstrap intervals retain repeated journeys within dates. This sample-window endpoint does not use elapsed-time derivatives. The corrected whole-record table, V8 localized-disturbance endpoints and V3 vehicle medians have separate definitions and cohort scopes. Their estimates are not pooled and do not establish causal seat effects.

Frozen estimates and sourcesMethods and intervals

Activity maximum HR across 161 governed ParaTransit sessions
60–69 bpm1
70–79 bpm1
80–89 bpm14
90–99 bpm19
100–109 bpm31
110–119 bpm40
120–129 bpm23
130–139 bpm12
140–149 bpm9
150–159 bpm4
160–169 bpm4
170–179 bpm3

The 100 bpm value is a subject-specific investigation reference. I first noticed unexpectedly high heart rate while sitting in ParaTransit, rather than while generating locomotor work; that observation prompted the transportation-burden analysis. It is not a universal clinical pain threshold. These bars are session maxima, not minutes above a threshold.

WHOOP longitudinal coverage

161 sessions112 dates · 2025-01-10 → 2026-08-29
87 bpmmedian activity mean HR
33/161activity means ≥100 bpm
126 sessionssession maximum HR ≥100 bpm
32 sessionssession maximum HR ≥130 bpm
20 sessionssession maximum HR ≥140 bpm
11 sessionssession maximum HR ≥150 bpm

Vigorous skating: high HR can accompany intentional cardiovascular work → self-generated propulsion → useful mobility. Seated ParaTransit: high HR can occur during externally generated transportation, with no self-propelled locomotor work. These are distinct functional contexts; the summaries do not assume identical physiology.

161 ParaTransit sessions on 112 dates (2025-01-10–2026-08-29). Duration median 38 min, IQR 33–45. Activity mean HR median 87 bpm; activity max HR median 112 bpm.

33 activity means and 126 activity maxima reached ≥100 bpm. The higher maximum-HR tails are shown below. Neither is a pain marker.

WHOOP activity maximum HR tails
At leastSessions
100 bpm126/161
130 bpm32/161
140 bpm20/161
150 bpm11/161
WHOOP longitudinal ParaTransit by year
YearSessionsDatesMedian mean HR bpmMedian max HR bpmMax ≥100 bpm
202531308912024
20261308287111102
Governed ParaTransit subtype identities
SubtypeWHOOP sessions
Bus19
Sedan/Taxi23
SilverRide7
ParaTransit — vehicle unknown106
Van6

WHOOP summary HR is not native HR integration. Time above HR thresholds is unsupported by these activity summaries. Baseline-linked delta: 122 observed, 39 missing; median 36 bpm.

Independently governed SilverRide seat context

Sparse SilverRide seat and first-person pain context
SeatGoverned sessionsPain observation
FrontSeat7No pain reported
BackSeat2Pain reported

The BackSeat group has no current canonical activity-signature metric. The earlier governed seat aggregates do not demonstrate a larger BackSeat RMS or jerk median. Pain may also involve ingress/egress. This is descriptive context, not a causal seat effect.

Motorcycle comparison

2 governed pain=0 activities on 1 date. Across a different BC-01 morphology population (6 activities), median magnitude RMS was 0.197 g; these are not the same two pain-labeled activities and are not the V3 vertical-RMS cohort. In WHOOP motorcycle summaries (208 activities), median mean HR was 93 bpm and median max HR 134 bpm. This is an active, mitigated vehicle context; pain may begin after longer exposure and feet-down movement may change the experience. It cannot serve as an equivalent passive-seat control. Motion magnitude alone is not a pain measurement.

The May 23 Bus case below shows an extreme measured mechanics→physiology sequence. Its first-person pain context is separate from sensor readings; the SDNN direction was not the population-average response.

Source scope and provenance

TRANSPORT-CONTEXT-01 review candidate 20261005T-TRANSPORT-CONTEXT-01-V5. WHOOP parent: CALC-MOB-02 V7; corrected native ride mechanics: frozen TRANSPORT-BURDEN-01 V3, 200 Hz ACC timing; pain/seat and motorcycle context: BC-01. These sources have different denominators and are not combined into a pain score.

V7 manifest SHA-256: 38d3eb93dae16bb34e786307a8c69f0127e909ef394789495d4c7ca4135a58d7. V3 manifest SHA-256: 8c19c78d1a5cf76f49de7c105d389992e0628d89c6462831be1e3ecd1b8982d8.

Publication projection

FUNCTIONAL CONTEXT · LONGITUDINAL ACTIVITY HR

High HR means different things in different activities

These source-specific activity summaries provide context; they are not matched distributions.

FNS/SNS skating · self-propelled115 bpm1,165 HR-supported activity records
ParaTransit · externally transported87 bpm161 governed WHOOP sessions · 112 dates

Vigorous skating: high HR can accompany intentional cardiovascular work → self-generated propulsion → useful mobility.

Seated ParaTransit: I first noticed unexpectedly high heart rate while sitting in transportation, rather than while generating locomotor work. That observation motivated this transportation-burden analysis.

Activity mean HR reached ≥100 bpm in 33/161 sessions. Session maximum HR reached ≥100 bpm in 126, ≥130 bpm in 32, ≥140 bpm in 20, and ≥150 bpm in 11 sessions. Maxima do not show time above a threshold.

100 bpm is a subject-specific investigation reference, not a universal clinical pain threshold. HR does not itself measure pain. Function/pain, mechanics and physiology remain separate evidence tracks.

EXPLORATORY PHYSIOLOGY SIGNAL

The current linked subset shows lower HRV summaries when activity-mean HR is high

Among accepted same-event WHOOP–Kubios links, the 11 sessions with activity-mean HR ≥100 bpm had lower RMSSD, SDNN and pNN50 medians than 44 linked sessions below 100 bpm. Ride-level RMS, corrected jerk, shock, cumulative shock and duration did not shift consistently.

Current linked subset · median [IQR] and high-minus-lower median difference with date-block 95% interval
MeasureMean HR ≥100 bpmMean HR <100 bpmDifference [95% interval]
RMSSD (ms)n=11: 9.98 [5.22, 19.07]n=44: 36.91 [24.01, 87.98]-26.93 [-39.25, -10.57]
SDNN (ms)n=11: 28.94 [22.60, 33.54]n=44: 65.70 [49.09, 76.89]-36.76 [-46.36, -27.34]
pNN50 (percentage points)n=11: 0.61 [0.15, 1.39]n=44: 8.39 [1.27, 59.87]-7.79 [-12.48, -2.91]
Vertical RMS (g)n=11: 0.128 [0.123, 0.177]n=44: 0.160 [0.137, 0.181]-0.033 [-0.048, 0.031]
Corrected jerk (g/s)n=11: 0.739 [0.570, 0.958]n=44: 0.807 [0.578, 1.136]-0.069 [-0.344, 0.266]
Shock rate (per min)n=11: 24.35 [19.40, 27.88]n=44: 23.77 [21.59, 26.87]0.58 [-5.36, 7.29]
Cumulative dynamic shock (native metric scale)n=11: 365.1 [346.3, 438.4]n=44: 446.1 [353.8, 733.1]-80.9 [-320.6, 41.8]
Duration (min)n=33: 39.0 [33.0, 48.0]n=128: 37.0 [33.0, 43.3]2.0 [-4.0, 6.0]

Intervals are descriptive date-block bootstrap summaries; they are not a universal mechanism or a pain measure. No separately governed same-event pain observation is linked in this subset. Function/pain, mechanics, physiology and exposure/time remain distinct evidence tracks.

Observed now: lower HRV summaries co-occur in this linked subset while ride-level mechanics show no consistent group shift. Continuing data will test: whether this separation persists as prospective observations accumulate.

Vehicle, body and pain context

59ParaTransit rides
3,888ride-bound windows
38.48 mintypical ride · median
92:53longest measured ride

Duration tells only part of the story. Continuous sensors show how mechanical and physiological exposure unfolded during each ride.

FUNCTION / PAIN · MECHANICS · PHYSIOLOGY

Two ways transportation became burdensome

MAY 23 · PROLONGED + ESCALATING

92:53 · duration extreme

MECHANICS: 24-minute late sustained episode; RMS >P90 for 22 min and jerk >P90 for 22 min. Peak RMS ≈0.217 g; peak corrected jerk ≈12.94 g/s at minute 81.

PHYSIOLOGY · after the mechanical peak: SDNN +54.25 ms, #1/29; fine HR +10.09 bpm, #2/32.

May 23 is an extreme case in context. Pain timing is not inferred from telemetry.

OCTOBER 2 · ORDINARY DURATION + ABRUPT MECHANICS

40:50 · duration P64.4

MECHANICS: corrected jerk 6.13 g/s, P93.2 / rank 5 of 59; >P75 for 35.74 min / 87.9%; >P90 for 16.91 min / 41.6%.

FUNCTION / PAIN: no linked timestamped pain or termination observation in this PRE projection. PHYSIOLOGY: separately measured; not a pain measure.

Corrected prospective observation · Strava corroboration pending.

Transportation burden is multidimensional. Duration alone does not identify a mechanically burdensome ride. No combined burden score is calculated.

1 · Duration

Most rides were much shorter.

The median was 38.48 minutes. The longest measured ride lasted 92:53.

All 59 historical ParaTransit ride durationsSorted ride durations with median, P75, P90 and P95 reference lines. Five prolonged rides are marked with diamonds and named below. The longest was May 23 at 92 minutes 53 seconds.Median 38.48 minP75 43.03 minP90 52.38 minP95 63.87 min2026-05-23 Bus: 92:53, rank 1/592026-06-20 Van: 78:18, rank 2/592026-08-22 SilverRide: 64:04, rank 3/592026-06-05 SilverRide: 63:51, rank 4/592026-07-18 Sedan/Taxi: 60:38, rank 5/59ShortestLongest
Each dot is one governed telemetry-linked ride. Diamonds mark the five prespecified prolonged rides.
  1. 2026-05-23 Bus92:53 · rank 1/59
  2. 2026-06-20 Van78:18 · rank 2/59
  3. 2026-08-22 SilverRide64:04 · rank 3/59
  4. 2026-06-05 SilverRide63:51 · rank 4/59
  5. 2026-07-18 Sedan/Taxi60:38 · rank 5/59
Inspect all 59 ranked durations
Historical rides, shortest to longest; only duration is shown for unfeatured rides.
Ascending rankDuration
129:15
230:54
331:01
433:05
533:45
634:08
734:09
835:02
935:15
1035:42
1135:56
1236:00
1336:11
1436:12
1536:23
1636:27
1736:33
1836:36
1936:43
2037:09
2137:10
2237:18
2337:18
2437:20
2537:22
2637:31
2737:58
2838:14
2938:25
3038:29
3138:38
3238:53
3339:07
3439:35
3539:56
3640:19
3740:43
3840:44
3941:18
4041:46
4142:06
4242:27
4342:42
4442:47
4543:16
4643:31
4743:57
4844:20
4944:59
5045:16
5146:41
5247:20
5352:17
5452:47
5560:38
5663:51
5764:04
5878:18
5992:53

4 · Different burden signatures

Long duration did not produce one uniform pattern.

These bars compare time above each metric's own historical P75, not acceleration, heart rate, and shock magnitude on a shared scale.

2026-05-23 · Bus · 92:53

Sustained and rising mechanical exposure

Share of entire ride above each historical P75 window threshold:

Mean heart rate0.0%
Vertical RMS67.7%
Corrected jerk67.7%
Shock rate48.4%

2026-06-20 · Van · 78:18

Shock-dominant persistence

Share of entire ride above each historical P75 window threshold:

Mean heart rate3.8%
Vertical RMS7.7%
Corrected jerk26.8%
Shock rate75.7%

2026-08-22 · SilverRide · 64:04

Mixed HR and shock response

Share of entire ride above each historical P75 window threshold:

Mean heart rate37.4%
Vertical RMS14.2%
Corrected jerk4.8%
Shock rate59.3%

2026-06-05 · SilverRide · 63:51

Shock persistence

Share of entire ride above each historical P75 window threshold:

Mean heart rate15.4%
Vertical RMS7.6%
Corrected jerk6.3%
Shock rate62.6%

2026-07-18 · Sedan/Taxi · 60:38

Long duration with lower instantaneous mechanics

Share of entire ride above each historical P75 window threshold:

Mean heart rate1.6%
Vertical RMS2.7%
Corrected jerk0.0%
Shock rate21.4%
Explore the complete ride comparisons and measured sequences

CORRECTED PROSPECTIVE OBSERVATION · STRAVA CORROBORATION PENDING

Prospective check: October 2

A ride does not have to be long to be mechanically abrupt. Oct 2 duration was P64.4 in the historical 59-ride reference; corrected jerk was P93.2, rank 5/59.

40:50Duration · P64.4 ordinary-range
6.13 g/sCorrected jerk · P93.2 · rank 5/59
35.74 minAbove historical one-minute P75 jerk · 87.9% of observed time
16.91 minAbove historical one-minute P90 jerk · 41.6% of observed time

Separate whole-ride positions in the frozen reference

Each point is a separate empirical percentile on a common 0–100 reference axis. This is not a combined score. Whole-ride percentiles use 59 historical rides; one-minute persistence below uses pooled one-minute reference thresholds.

Oct 2 one-minute persistence using frozen V3 pooled one-minute P75 and P90 thresholds
MeasureAbove P75Above P90
Vertical RMS18.82 min · 46.3%1.00 min · 2.5%
Corrected jerk35.74 min · 87.9%16.91 min · 41.6%
Shock rate7.00 min · 17.2%2.00 min · 4.9%

Corrected jerk: 87.9% of observed ACC time was above P75; 41.6% was above P90 (40.66 observed minutes across 41 fixed ride-clock one-minute windows).

Function / pain

This projection contains no linked, timestamped pain or functional-termination observation for this PRE interval.

Mechanics

Whole-ride RMS 0.13353 g (P33.9); corrected jerk 6.12689 g/s (P93.2); shock 98.61/min (P57.6). These describe separate mechanical properties, not pain.

Physiology

Mean HR 78.91 bpm (P30.5); RMSSD 23.64 ms (P35.6); SDNN 47.93 ms (P37.3). These are separate physiological measures, not pain measures.

Compared with 20261005T-TRANSPORT-BURDEN-01-V3, 2026-05-15 through 2026-09-06, n=59, reference manifest 8c19c78d1a5cf76f49de7c105d389992e0628d89c6462831be1e3ecd1b8982d8. The Oct 2 observation is prospective and is not added to that frozen reference. Percentiles are subject-specific descriptive positions, not clinical thresholds. The 40:50 boundary remains operator-confirmed pending corrected Strava corroboration.

A common visual language · separate physical quantities

Which measurements were elevated at the same time?

Each row is compared with its own frozen historical reference: Equal-weight distribution of 59 ride medians of one-minute summaries, not pooled-window percentiles. P75 means the upper quarter of that ride-level reference—not a clinical threshold. Bands do not make HR, RMS, jerk and shock interchangeable.

≤P50P50–P75P75–P90>P90× Missing

2026-05-23 · 92:53

RMS and jerk simultaneously elevated window support: 59.88 min. HR and shock: 0.00 min. “Simultaneous” here means the same one-minute windows had both summaries above P75, not that every instant exceeded both thresholds. Coverage bounds are used where within-window overlap is unknown.

Read exact values, bands and observed support for this ride
One-minute raw values and reference bands
ElapsedMean HR bpmRMS gJerk g/sShock /min
0:00–1:0081.233; ≤P50; 59.22 s support0.129360; >P90; 60.00 s support5.438; >P90; 60.00 s support102.000; P50–P75; 60.00 s support
1:00–2:0077.539; ≤P50; 60.00 s support0.095475; P50–P75; 60.00 s support3.538; P50–P75; 60.00 s support121.000; P75–P90; 60.00 s support
2:00–3:0082.223; ≤P50; 59.91 s support0.114260; P75–P90; 60.00 s support5.937; >P90; 60.00 s support85.000; ≤P50; 60.00 s support
3:00–4:0081.660; ≤P50; 60.00 s support0.086314; P50–P75; 60.00 s support7.691; >P90; 60.00 s support146.000; >P90; 60.00 s support
4:00–5:0080.286; ≤P50; 59.81 s support0.074841; P50–P75; 60.00 s support6.002; >P90; 60.00 s support171.000; >P90; 60.00 s support
5:00–6:0080.765; ≤P50; 60.00 s support0.071258; P50–P75; 60.00 s support7.414; >P90; 60.00 s support180.000; >P90; 60.00 s support
6:00–7:0080.823; ≤P50; 59.42 s support0.107487; P75–P90; 60.00 s support7.323; >P90; 60.00 s support107.000; P50–P75; 60.00 s support
7:00–8:0081.953; ≤P50; 60.00 s support0.135875; >P90; 60.00 s support5.705; >P90; 60.00 s support111.000; P50–P75; 60.00 s support
8:00–9:0080.427; ≤P50; 60.00 s support0.167683; >P90; 60.00 s support6.782; >P90; 60.00 s support98.000; P50–P75; 60.00 s support
9:00–10:0080.885; ≤P50; 59.39 s support0.108253; P75–P90; 60.00 s support4.742; >P90; 60.00 s support120.000; P75–P90; 60.00 s support
10:00–11:0080.222; ≤P50; 60.00 s support0.134096; >P90; 60.00 s support6.295; >P90; 60.00 s support112.000; P75–P90; 60.00 s support
11:00–12:0080.753; ≤P50; 59.51 s support0.124407; >P90; 60.00 s support4.876; >P90; 60.00 s support107.000; P50–P75; 60.00 s support
12:00–13:0081.111; ≤P50; 59.97 s support0.122404; >P90; 60.00 s support3.910; P75–P90; 60.00 s support90.000; ≤P50; 60.00 s support
13:00–14:0078.896; ≤P50; 60.00 s support0.044040; ≤P50; 60.00 s support1.495; ≤P50; 60.00 s support64.000; ≤P50; 60.00 s support
14:00–15:0078.281; ≤P50; 59.81 s support0.014809; ≤P50; 60.00 s support0.881; ≤P50; 60.00 s support214.000; >P90; 60.00 s support
15:00–16:0077.760; ≤P50; 60.00 s support0.013338; ≤P50; 60.00 s support0.863; ≤P50; 60.00 s support186.000; >P90; 60.00 s support
16:00–17:0077.704; ≤P50; 60.00 s support0.014431; ≤P50; 60.00 s support1.013; ≤P50; 60.00 s support154.000; >P90; 60.00 s support
17:00–18:0076.904; ≤P50; 59.45 s support0.023849; ≤P50; 60.00 s support0.990; ≤P50; 60.00 s support137.000; >P90; 60.00 s support
18:00–19:0079.596; ≤P50; 60.00 s support0.093060; P50–P75; 60.00 s support3.407; P50–P75; 60.00 s support115.000; P75–P90; 60.00 s support
19:00–20:0079.792; ≤P50; 59.69 s support0.133820; >P90; 60.00 s support5.908; >P90; 60.00 s support108.000; P50–P75; 60.00 s support
20:00–21:0077.749; ≤P50; 60.00 s support0.114566; >P90; 60.00 s support4.984; >P90; 60.00 s support106.000; P50–P75; 60.00 s support
21:00–22:0079.722; ≤P50; 59.58 s support0.164416; >P90; 60.00 s support6.162; >P90; 60.00 s support89.000; ≤P50; 60.00 s support
22:00–23:0078.514; ≤P50; 60.00 s support0.114451; >P90; 60.00 s support3.822; P50–P75; 60.00 s support90.000; ≤P50; 60.00 s support
23:00–24:0077.805; ≤P50; 59.43 s support0.105797; P75–P90; 60.00 s support4.233; P75–P90; 60.00 s support111.000; P50–P75; 60.00 s support
24:00–25:0078.681; ≤P50; 60.00 s support0.047694; ≤P50; 60.00 s support1.860; ≤P50; 60.00 s support109.000; P50–P75; 60.00 s support
25:00–26:0079.021; ≤P50; 60.00 s support0.153880; >P90; 60.00 s support5.987; >P90; 60.00 s support104.000; P50–P75; 60.00 s support
26:00–27:0079.246; ≤P50; 59.88 s support0.213717; >P90; 60.00 s support6.857; >P90; 60.00 s support82.000; ≤P50; 60.00 s support
27:00–28:0078.747; ≤P50; 59.54 s support0.180044; >P90; 60.00 s support6.297; >P90; 60.00 s support94.000; ≤P50; 60.00 s support
28:00–29:0078.676; ≤P50; 60.00 s support0.080310; P50–P75; 60.00 s support2.978; P50–P75; 60.00 s support127.000; >P90; 60.00 s support
29:00–30:0078.406; ≤P50; 59.79 s support0.140313; >P90; 60.00 s support5.055; >P90; 60.00 s support83.000; ≤P50; 60.00 s support
30:00–31:0078.603; ≤P50; 60.00 s support0.150810; >P90; 60.00 s support5.058; >P90; 60.00 s support84.000; ≤P50; 60.00 s support
31:00–32:0078.117; ≤P50; 59.97 s support0.149110; >P90; 60.00 s support4.232; P75–P90; 60.00 s support98.000; P50–P75; 60.00 s support
32:00–33:0076.989; ≤P50; 60.00 s support0.129184; >P90; 60.00 s support3.804; P50–P75; 60.00 s support104.000; P50–P75; 60.00 s support
33:00–34:0077.964; ≤P50; 60.00 s support0.149571; >P90; 60.00 s support4.847; >P90; 60.00 s support64.000; ≤P50; 60.00 s support
34:00–35:0077.757; ≤P50; 59.43 s support0.047164; ≤P50; 60.00 s support1.498; ≤P50; 60.00 s support129.000; >P90; 60.00 s support
35:00–36:0077.473; ≤P50; 60.00 s support0.008207; ≤P50; 60.00 s support0.860; ≤P50; 60.00 s support334.000; >P90; 60.00 s support
36:00–37:0078.114; ≤P50; 59.94 s support0.018751; ≤P50; 60.00 s support0.947; ≤P50; 60.00 s support172.000; >P90; 60.00 s support
37:00–38:0076.458; ≤P50; 59.69 s support0.016296; ≤P50; 60.00 s support0.911; ≤P50; 60.00 s support273.000; >P90; 60.00 s support
38:00–39:0076.077; ≤P50; 60.00 s support0.028597; ≤P50; 60.00 s support0.938; ≤P50; 60.00 s support196.000; >P90; 60.00 s support
39:00–40:0075.081; ≤P50; 59.96 s support0.013166; ≤P50; 60.00 s support0.819; ≤P50; 60.00 s support255.000; >P90; 60.00 s support
40:00–41:0075.964; ≤P50; 60.00 s support0.017316; ≤P50; 60.00 s support0.801; ≤P50; 60.00 s support244.000; >P90; 60.00 s support
41:00–42:0075.584; ≤P50; 60.00 s support0.015259; ≤P50; 60.00 s support0.858; ≤P50; 60.00 s support205.000; >P90; 60.00 s support
42:00–43:0074.865; ≤P50; 59.36 s support0.053764; ≤P50; 60.00 s support1.693; ≤P50; 60.00 s support90.000; ≤P50; 60.00 s support
43:00–44:0074.762; ≤P50; 60.00 s support0.136967; >P90; 60.00 s support5.459; >P90; 60.00 s support87.000; ≤P50; 60.00 s support
44:00–45:0077.678; ≤P50; 60.00 s support0.135079; >P90; 60.00 s support4.249; P75–P90; 60.00 s support81.000; ≤P50; 60.00 s support
45:00–46:0075.331; ≤P50; 59.77 s support0.153965; >P90; 60.00 s support6.456; >P90; 60.00 s support125.000; >P90; 60.00 s support
46:00–47:0074.376; ≤P50; 59.72 s support0.120516; >P90; 60.00 s support3.507; P50–P75; 60.00 s support96.000; ≤P50; 60.00 s support
47:00–48:0077.119; ≤P50; 59.99 s support0.134748; >P90; 60.00 s support5.018; >P90; 60.00 s support99.000; P50–P75; 60.00 s support
48:00–49:0077.235; ≤P50; 60.00 s support0.159253; >P90; 60.00 s support7.500; >P90; 60.00 s support118.000; P75–P90; 60.00 s support
49:00–50:0075.828; ≤P50; 59.38 s support0.139851; >P90; 60.00 s support6.655; >P90; 60.00 s support88.000; ≤P50; 60.00 s support
50:00–51:0076.215; ≤P50; 60.00 s support0.138600; >P90; 60.00 s support6.317; >P90; 60.00 s support111.000; P50–P75; 60.00 s support
51:00–52:0078.590; ≤P50; 59.60 s support0.140945; >P90; 60.00 s support6.387; >P90; 60.00 s support90.000; ≤P50; 60.00 s support
52:00–53:0077.610; ≤P50; 60.00 s support0.149027; >P90; 60.00 s support6.911; >P90; 60.00 s support91.000; ≤P50; 60.00 s support
53:00–54:0076.585; ≤P50; 59.55 s support0.151868; >P90; 60.00 s support7.676; >P90; 60.00 s support150.000; >P90; 60.00 s support
54:00–55:0077.940; ≤P50; 60.00 s support0.173435; >P90; 60.00 s support9.544; >P90; 60.00 s support119.000; P75–P90; 60.00 s support
55:00–56:0077.439; ≤P50; 60.00 s support0.161732; >P90; 60.00 s support8.092; >P90; 60.00 s support82.000; ≤P50; 60.00 s support
56:00–57:0074.555; ≤P50; 59.58 s support0.154080; >P90; 60.00 s support6.274; >P90; 60.00 s support113.000; P75–P90; 60.00 s support
57:00–58:0074.631; ≤P50; 60.00 s support0.154459; >P90; 60.00 s support4.852; >P90; 60.00 s support92.000; ≤P50; 60.00 s support
58:00–59:0074.279; ≤P50; 59.98 s support0.134918; >P90; 60.00 s support5.571; >P90; 60.00 s support108.000; P50–P75; 60.00 s support
59:00–60:0074.519; ≤P50; 59.64 s support0.037658; ≤P50; 60.00 s support1.307; ≤P50; 60.00 s support124.000; >P90; 60.00 s support
60:00–61:0075.065; ≤P50; 60.00 s support0.017965; ≤P50; 60.00 s support0.994; ≤P50; 60.00 s support237.000; >P90; 60.00 s support
61:00–62:0077.400; ≤P50; 59.80 s support0.017991; ≤P50; 60.00 s support0.974; ≤P50; 60.00 s support228.000; >P90; 60.00 s support
62:00–63:0073.225; ≤P50; 59.94 s support0.018443; ≤P50; 60.00 s support0.870; ≤P50; 60.00 s support261.000; >P90; 60.00 s support
63:00–64:0073.611; ≤P50; 60.00 s support0.016208; ≤P50; 60.00 s support0.969; ≤P50; 60.00 s support213.000; >P90; 60.00 s support
64:00–65:0072.314; ≤P50; 59.75 s support0.009954; ≤P50; 60.00 s support0.804; ≤P50; 60.00 s support355.000; >P90; 60.00 s support
65:00–66:0073.598; ≤P50; 60.00 s support0.008304; ≤P50; 60.00 s support0.800; ≤P50; 60.00 s support292.000; >P90; 60.00 s support
66:00–67:0074.724; ≤P50; 59.51 s support0.017734; ≤P50; 60.00 s support1.112; ≤P50; 60.00 s support167.000; >P90; 60.00 s support
67:00–68:0075.433; ≤P50; 60.00 s support0.053420; ≤P50; 60.00 s support2.027; ≤P50; 60.00 s support119.000; P75–P90; 60.00 s support
68:00–69:0077.735; ≤P50; 59.50 s support0.109093; P75–P90; 60.00 s support4.382; P75–P90; 60.00 s support92.000; ≤P50; 60.00 s support
69:00–70:0077.052; ≤P50; 60.00 s support0.160847; >P90; 60.00 s support7.351; >P90; 60.00 s support127.000; >P90; 60.00 s support
70:00–71:0076.791; ≤P50; 60.00 s support0.154233; >P90; 60.00 s support5.995; >P90; 60.00 s support102.000; P50–P75; 60.00 s support
71:00–72:0075.356; ≤P50; 59.74 s support0.173915; >P90; 60.00 s support7.233; >P90; 60.00 s support74.000; ≤P50; 60.00 s support
72:00–73:0077.057; ≤P50; 59.99 s support0.130614; >P90; 60.00 s support6.765; >P90; 60.00 s support130.000; >P90; 60.00 s support
73:00–74:0074.648; ≤P50; 60.00 s support0.132652; >P90; 60.00 s support7.523; >P90; 60.00 s support146.000; >P90; 60.00 s support
74:00–75:0073.905; ≤P50; 60.00 s support0.132273; >P90; 60.00 s support7.447; >P90; 60.00 s support132.000; >P90; 60.00 s support
75:00–76:0074.420; ≤P50; 59.67 s support0.158077; >P90; 60.00 s support7.647; >P90; 60.00 s support103.000; P50–P75; 60.00 s support
76:00–77:0075.150; ≤P50; 59.97 s support0.158219; >P90; 60.00 s support8.785; >P90; 60.00 s support138.000; >P90; 60.00 s support
77:00–78:0072.156; ≤P50; 59.89 s support0.170033; >P90; 60.00 s support7.416; >P90; 60.00 s support74.000; ≤P50; 60.00 s support
78:00–79:0074.494; ≤P50; 60.00 s support0.170862; >P90; 60.00 s support8.804; >P90; 60.00 s support105.000; P50–P75; 60.00 s support
79:00–80:0073.411; ≤P50; 59.67 s support0.201865; >P90; 60.00 s support9.687; >P90; 60.00 s support122.000; >P90; 60.00 s support
80:00–81:0077.049; ≤P50; 60.00 s support0.202017; >P90; 60.00 s support9.373; >P90; 60.00 s support118.000; P75–P90; 60.00 s support
81:00–82:0075.078; ≤P50; 60.00 s support0.216945; >P90; 60.00 s support12.944; >P90; 60.00 s support153.000; >P90; 60.00 s support
82:00–83:0074.245; ≤P50; 59.98 s support0.172467; >P90; 60.00 s support7.974; >P90; 60.00 s support70.000; ≤P50; 60.00 s support
83:00–84:0073.557; ≤P50; 60.00 s support0.176652; >P90; 60.00 s support8.102; >P90; 60.00 s support96.000; ≤P50; 60.00 s support
84:00–85:0072.182; ≤P50; 59.89 s support0.182827; >P90; 60.00 s support8.902; >P90; 60.00 s support109.000; P50–P75; 60.00 s support
85:00–86:0071.160; ≤P50; 59.99 s support0.104617; P75–P90; 60.00 s support4.551; >P90; 60.00 s support114.000; P75–P90; 60.00 s support
86:00–87:0072.594; ≤P50; 59.58 s support0.122476; >P90; 60.00 s support4.684; >P90; 60.00 s support98.000; P50–P75; 60.00 s support
87:00–88:0073.470; ≤P50; 60.00 s support0.123325; >P90; 60.00 s support5.965; >P90; 60.00 s support116.000; P75–P90; 60.00 s support
88:00–89:0074.672; ≤P50; 59.52 s support0.125472; >P90; 60.00 s support5.724; >P90; 60.00 s support122.000; >P90; 60.00 s support
89:00–90:0091.714; P50–P75; 60.00 s support0.188723; >P90; 60.00 s support4.603; >P90; 60.00 s support77.000; ≤P50; 60.00 s support
90:00–91:0093.320; P50–P75; 60.00 s support0.190943; >P90; 60.00 s support3.971; P75–P90; 60.00 s support86.000; ≤P50; 60.00 s support
91:00–92:0089.557; P50–P75; 59.69 s support0.119771; >P90; 60.00 s support7.769; >P90; 60.00 s support106.000; P50–P75; 60.00 s support
92:00–92:5377.998; ≤P50; 50.97 s support0.109971; P75–P90; 53.00 s support5.279; >P90; 53.00 s support109.811; P50–P75; 53.00 s support

RMS and jerk are related mechanical measures. Their overlap is temporal description, not two independent confirmations. HR can remain comparatively quiet while mechanical exposure persists. The reference includes these featured rides; it is descriptive, not external validation.

AN EXTREME CASE IN CONTEXT · 2026-05-23 Bus

May 23: function, mechanics and physiology remain separate.

FUNCTION / PAIN

First-person context

Transportation pain observations are governed independently of telemetry. This case projection contains no timestamped May 23 pain onset, offset or activity-termination record; none is inferred from the peak or the HR response.

Pain and seat context

MECHANICS

Prolonged measured exposure

92:53 ride; late sustained episode 24 min. RMS >P90: 22 min; corrected jerk >P90: 22 min.

Mechanical peak: minute 81; RMS 0.217 g; corrected jerk 12.94 g/s. These are subject-specific empirical percentiles, not clinical pain thresholds.

PHYSIOLOGY

Physiology after the peak

Next supported-window SDNN: +54.25 ms, rank 1/29 supported mechanical episodes.

Fine HR +6–10 min: +10.09 bpm, rank 2/32. Late native HR: ≈91.8 bpm.

Independent measurements are read alongside observed or reported function and pain. RMS, jerk, shock, HR and HRV do not directly measure pain.

RMS and jerk stayed jointly elevated from minute 68 to 92. During that 24-minute episode, each exceeded its historical P90 for 22 minutes. At minute 81, RMS reached 0.217 g and corrected jerk 12.94 g/s.

+54.25 msSDNN in the next complete five-minute window versus its pre-event baseline · rank 1/29
+10.09 bpmOne-minute HR, minutes 6–10 after the peak versus the preceding five minutes · rank 2/32

The maximum governed one-minute HR within 15 minutes after the peak was 93.32 bpm, 18.87 bpm above the pre-peak five-minute mean. The final native 30-second RR-derived HR was about 91.8 bpm. The quieter five-minute mean can hide that short rise.

Solid: May 23 late eventDashed: median across ridesShaded: ride IQR

Vertical RMSMeasured magnitude · g
−15 minpeak window+15 min0.1920.085
Corrected jerkMeasured magnitude · g/s
−15 minpeak window+15 min9.633.61
SDNNChange from the preceding 15-minute baseline · ms
−15 minpeak window+15 min54.25-17.59
Five-minute mean HRChange from the preceding 15-minute baseline · bpm
−15 minpeak window+15 min3.5-5.4

May 23 is an extreme case in context. Next-window SDNN rose after 11/29 supported joint episodes, and only 5/15 ride-median responses were positive. The graph shows a measured sequence, not a universal HRV mechanism or a precise biological latency. A pain account is first-person evidence; mechanics and HR/HRV supply separately measured context.

Inspect exact event-aligned values, support, and provenance

Each dark point is the median of ride medians at that offset. Ride counts change with valid boundary coverage. May 23 has no complete five-minute HRV window at +10 or +15 after its late peak. Offset +5 is the next full window, not exactly five minutes after the peak minute. Mechanical thresholds and corrected 200 Hz ACC timing follow frozen TRANSPORT-BURDEN-01 V3.

May 23 versus the eligible ride median; each metric keeps its own unit.
Metric and offsetMay 23Ride medianRides
Vertical RMS · -15 min0.0940.12515
Vertical RMS · -10 min0.1470.12515
Vertical RMS · -5 min0.1730.12115
Vertical RMS · 0 min0.1920.14315
Vertical RMS · +5 min0.1400.11415
Vertical RMS · +10 minNo complete window0.11315
Vertical RMS · +15 minNo complete window0.09415
Corrected jerk · -15 min3.984.0215
Corrected jerk · -10 min7.024.3815
Corrected jerk · -5 min8.514.7815
Corrected jerk · 0 min9.635.7815
Corrected jerk · +5 min5.144.9715
Corrected jerk · +10 minNo complete window4.4015
Corrected jerk · +15 minNo complete window4.3715
SDNN · -15 min10.772.5515
SDNN · -10 min0.000.0015
SDNN · -5 min-2.04-3.9015
SDNN · 0 min10.01-2.2715
SDNN · +5 min54.25-2.5515
SDNN · +10 minNo complete window-7.0114
SDNN · +15 minNo complete window-4.0414
Five-minute mean HR · -15 min0.20.915
Five-minute mean HR · -10 min0.00.015
Five-minute mean HR · -5 min-1.60.015
Five-minute mean HR · 0 min-1.1-2.015
Five-minute mean HR · +5 min1.9-1.215
Five-minute mean HR · +10 minNo complete window-2.014
Five-minute mean HR · +15 minNo complete window-2.814

Source: TRANSPORT-PHYSIO-MECH-01 20261005T-TRANSPORT-PHYSIO-MECH-01-V5 · source status PRIVATE_EXPLORATORY · reviewed supporting-case projection and manifest hash. This descriptive series includes 51 RRI/HRV-eligible rides; 37 sustained joint mechanical episodes were detected on 15 rides. No pain score is calculated.

Continuous exposure · 2026-05-23 Bus

Mechanical loading persisted, then rose late in the ride.

On this 92:53 ride, vertical RMS and corrected jerk each remained above their historical P75 level for 62.88 minutes—67.7% of the entire ride. Cardiovascular quiet did not mean mechanically quiet transportation.

RMS describes acceleration fluctuation; jerk describes how abruptly acceleration changes; shock rate counts detected disturbances. Each panel has its own physical unit and scale. A one-minute summary smooths faster changes; it does not mean every sample was above the reference.

62.88 minRMS above P75
62.88 minjerk above P75
+90.8%RMS, beginning → end
+38.0%jerk, beginning → end

Solid: measured one-minute windowsDashed: historical P75Dotted: historical P90

Mean heart rateP75 94.6 · P90 107.2 bpm
P75 94.6 bpmP90 107.2 bpm0 min92:53
Vertical RMSP75 0.100 · P90 0.114 g
P75 0.100 gP90 0.114 g0 min92:53
Corrected jerkP75 3.84 · P90 4.51 g/s
P75 3.84 g/sP90 4.51 g/s0 min92:53
Shock rateP75 111.0 · P90 121.2 count/min
P75 111.0 count/minP90 121.2 count/min0 min92:53
Inspect all 93 one-minute windows and exact values
May 23 Bus, ride-bound one-minute windows. Blank sensor windows are labeled missing.
Elapsed ride timeMean HR (bpm)Vertical RMS (g)Corrected jerk (g/s)Shock rate (count/min)
0:00–1:0081.20.1295.44102.0
1:00–2:0077.50.0953.54121.0
2:00–3:0082.20.1145.9485.0
3:00–4:0081.70.0867.69146.0
4:00–5:0080.30.0756.00171.0
5:00–6:0080.80.0717.41180.0
6:00–7:0080.80.1077.32107.0
7:00–8:0082.00.1365.71111.0
8:00–9:0080.40.1686.7898.0
9:00–10:0080.90.1084.74120.0
10:00–11:0080.20.1346.30112.0
11:00–12:0080.80.1244.88107.0
12:00–13:0081.10.1223.9190.0
13:00–14:0078.90.0441.5064.0
14:00–15:0078.30.0150.88214.0
15:00–16:0077.80.0130.86186.0
16:00–17:0077.70.0141.01154.0
17:00–18:0076.90.0240.99137.0
18:00–19:0079.60.0933.41115.0
19:00–20:0079.80.1345.91108.0
20:00–21:0077.70.1154.98106.0
21:00–22:0079.70.1646.1689.0
22:00–23:0078.50.1143.8290.0
23:00–24:0077.80.1064.23111.0
24:00–25:0078.70.0481.86109.0
25:00–26:0079.00.1545.99104.0
26:00–27:0079.20.2146.8682.0
27:00–28:0078.70.1806.3094.0
28:00–29:0078.70.0802.98127.0
29:00–30:0078.40.1405.0583.0
30:00–31:0078.60.1515.0684.0
31:00–32:0078.10.1494.2398.0
32:00–33:0077.00.1293.80104.0
33:00–34:0078.00.1504.8564.0
34:00–35:0077.80.0471.50129.0
35:00–36:0077.50.0080.86334.0
36:00–37:0078.10.0190.95172.0
37:00–38:0076.50.0160.91273.0
38:00–39:0076.10.0290.94196.0
39:00–40:0075.10.0130.82255.0
40:00–41:0076.00.0170.80244.0
41:00–42:0075.60.0150.86205.0
42:00–43:0074.90.0541.6990.0
43:00–44:0074.80.1375.4687.0
44:00–45:0077.70.1354.2581.0
45:00–46:0075.30.1546.46125.0
46:00–47:0074.40.1213.5196.0
47:00–48:0077.10.1355.0299.0
48:00–49:0077.20.1597.50118.0
49:00–50:0075.80.1406.6588.0
50:00–51:0076.20.1396.32111.0
51:00–52:0078.60.1416.3990.0
52:00–53:0077.60.1496.9191.0
53:00–54:0076.60.1527.68150.0
54:00–55:0077.90.1739.54119.0
55:00–56:0077.40.1628.0982.0
56:00–57:0074.60.1546.27113.0
57:00–58:0074.60.1544.8592.0
58:00–59:0074.30.1355.57108.0
59:00–60:0074.50.0381.31124.0
60:00–61:0075.10.0180.99237.0
61:00–62:0077.40.0180.97228.0
62:00–63:0073.20.0180.87261.0
63:00–64:0073.60.0160.97213.0
64:00–65:0072.30.0100.80355.0
65:00–66:0073.60.0080.80292.0
66:00–67:0074.70.0181.11167.0
67:00–68:0075.40.0532.03119.0
68:00–69:0077.70.1094.3892.0
69:00–70:0077.10.1617.35127.0
70:00–71:0076.80.1545.99102.0
71:00–72:0075.40.1747.2374.0
72:00–73:0077.10.1316.76130.0
73:00–74:0074.60.1337.52146.0
74:00–75:0073.90.1327.45132.0
75:00–76:0074.40.1587.65103.0
76:00–77:0075.20.1588.79138.0
77:00–78:0072.20.1707.4274.0
78:00–79:0074.50.1718.80105.0
79:00–80:0073.40.2029.69122.0
80:00–81:0077.00.2029.37118.0
81:00–82:0075.10.21712.94153.0
82:00–83:0074.20.1727.9770.0
83:00–84:0073.60.1778.1096.0
84:00–85:0072.20.1838.90109.0
85:00–86:0071.20.1054.55114.0
86:00–87:0072.60.1224.6898.0
87:00–88:0073.50.1235.97116.0
88:00–89:0074.70.1255.72122.0
89:00–90:0091.70.1894.6077.0
90:00–91:0093.30.1913.9786.0
91:00–92:0089.60.1207.77106.0
92:00–92:5378.00.1105.28109.8

Within-ride trajectory

A session median cannot tell you how the ride ended.

The same median can accompany improving, sustained, or worsening exposure. On May 23, mechanics rose toward the end while HR stayed comparatively quiet. Beginning, middle, and end summarize the first three, middle four, and final three ride deciles; they are not individual moments. Each metric keeps its own unit.

May 23 Bus: beginning → middle → end, from governed ride-decile summaries.
MeasureBeginningMiddleEnd
Mean heart rate bpm79.676.376.8
Vertical RMS g0.1140.1100.217
Corrected jerk g/s4.994.356.88
Shock rate count/min102.6108.1109.5
Inspect accumulation and exact ride statistics

Intensity is measured magnitude. Persistence is time above a historical threshold. Accumulation integrates measured values over validated elapsed time. They are not combined into a burden score.

Stored V3 time-integrated measures for the five prolonged rides.
RideHR (bpm*min)RMS (g*min)Jerk ((g/s)*min)Window shock rate ((count/min)*min)Dynamic magnitude (g*s)HR excess AUC (bpm*min)
2026-05-23 Bus7163.510.33454.2912124411.878.63
2026-06-20 Van6109.64.81214.7010616142.2331.45
2026-08-22 SilverRide5913.24.37151.237492121.41297.18
2026-06-05 SilverRide5677.63.27132.908308113.17175.52
2026-07-18 Sedan/Taxi4700.73.87101.565844130.7712.32

Window shock-rate integration uses window-local detection and should not be substituted for a whole-ride shock count. HR excess AUC uses the V3 historical one-minute mean-HR reference.

Methods, measurement authority, and provenance

59 governed telemetry-linked ParaTransit rides, 2026-05-15 through 2026-09-06; 3888 ride-bound windows. Polar H10/Kubios Custom ACC uses the verified physical 200 Hz authority where applicable. The reference percentiles give each ride equal weight: they are drawn from the 59 ride medians of one-minute summaries, not from pooled windows. This is a frozen N-of-1 descriptive series.

Ride duration is not schedule lateness. Telemetry measures exposure, not pain. The five displayed rides show distinct patterns and do not establish a causal vehicle or seat effect. The corrected prospective observation is excluded from this public projection.

Experiment
20261005T-TRANSPORT-BURDEN-01-V3
Frozen analysis commit
585a02548624134c61da161b0f9ba27c3a9a8060
Frozen manifest SHA-256
8c19c78d1a5cf76f49de7c105d389992e0628d89c6462831be1e3ecd1b8982d8
Corrected reference SHA-256
4cdcd0f94b07fd90c55fd9f69da496fcae2ca32b4babe3aef67e18101e9346fd
Measurement authority
kubios_h10_acc_timebase_20260922.v1

Reviewed public dataOpen Evidence ObservatoryCALC-MOB-02 analysis

Technical analyses, exploratory contrasts and source provenance

Separate CALC-MOB-02 recording-level analysis

Bus had the highest approved median A2/min and J2/min

Among the approved ParaTransit vehicle aggregates, Bus had the highest median squared-acceleration exposure rate (A2/min) and squared-jerk exposure rate (J2/min). Bus also had the highest approved median cumulative A2 and J2. These are descriptive observations of one participant, with repeated sessions and dates.

HOW INTENSE EACH MINUTE?

Per-minute calculus

A2/min and J2/min measure exposure rate. Squaring gives larger accelerations or abrupt changes more weight.

HOW MUCH ACCUMULATED?

Raw integrals

A2 and J2 add squared acceleration and squared jerk over observed recording time. A longer exposure can accumulate more even when its rate is similar.

WHAT DOES JERK MEAN?

Abrupt changes

Jerk describes how quickly acceleration changes. A1 and J1 accumulate absolute acceleration and absolute jerk; A2 and J2 give larger changes more weight.

ParaTransit Bus medians: A2/min 1.9501714401919803 g^2*s/min; J2/min 1355.674448715793 g^2/s/min; cumulative A2 82.96215116523868 g^2*s; cumulative J2 58040.37719999852 g^2/s. Values retain the approved projection's precision.

Approved native ACC medians; repeated observations of one participant
VehicleSessionsDatesA2 — accumulated squared acceleration/min — exposure rate (g^2*s/min)J2 — accumulated squared jerk/min — exposure rate (g^2/s/min)A2 — accumulated squared acceleration — cumulative exposure (g^2*s)J2 — accumulated squared jerk — cumulative exposure (g^2/s)
ParaTransit Bus25201.95017144019198031355.67444871579382.9621511652386858040.37719999852
ParaTransit Van771.120149324409727960.64490857617858.3158051459877635159.52360014573
ParaTransit Sedan/Taxi26191.1346009828128263305.0586910674764544.2389968518935611126.587699967524
ParaTransit SilverRide10100.8382302228022627445.1127387433374543.6003118777419319021.508099991108

Sessions and dates are repeated observations, not independent participants. Rate medians and cumulative medians are separate summaries; multiplying group medians does not reconstruct accumulated exposure.

Recording duration and measurement support; not necessarily complete trips
VehicleMedian observed ACC duration (seconds)Support status
ParaTransit Bus2471.035OBSERVED_NATIVE_ACC_DESCRIPTIVE
ParaTransit Van2379.415OBSERVED_NATIVE_ACC_DESCRIPTIVE
ParaTransit Sedan/Taxi2221.375OBSERVED_NATIVE_ACC_DESCRIPTIVE
ParaTransit SilverRide2382.745OBSERVED_NATIVE_ACC_DESCRIPTIVE

Descriptive Bus–Sedan/Taxi contrasts

Differences in exposure, with exploratory intervals

Each contrast below is Bus minus Sedan/Taxi: a difference of date medians with a joint-date bootstrap descriptive 95% interval. These are differences, not ratios or matched-date paired estimates. The comparison includes 20 Bus dates and 19 Sedan/Taxi dates, with 5 overlapping dates.

Support: DESCRIPTIVE_EXPLORATORY_N_OF_1. Intervals are exploratory and unadjusted (EXPLORATORY_UNADJUSTED_INTERVAL); they do not establish a causal vehicle effect. Routes are not verified.

Differences of date medians; exploratory, unadjusted joint-date bootstrap intervals
ExposureBus minus Sedan/TaxiDescriptive 95% intervalUnitSupport status
A1 — accumulated absolute acceleration — cumulative exposure104.6169566523756289.4693842948983 to 119.27441409687958g*sEXPLORATORY_UNADJUSTED_INTERVAL
A2 — accumulated squared acceleration — cumulative exposure38.0952954646424229.266712658208355 to 47.70828814222601g^2*sEXPLORATORY_UNADJUSTED_INTERVAL
J1 — accumulated absolute jerk — cumulative exposure4842.3222499999993824.0975 to 6249.9375gEXPLORATORY_UNADJUSTED_INTERVAL
J2 — accumulated squared jerk — cumulative exposure50648.9875500407339004.886410003775 to 75134.0815999564g^2/sEXPLORATORY_UNADJUSTED_INTERVAL
A1 — accumulated absolute acceleration/min — exposure rate2.16722098408388761.8022351979939135 to 2.906147150035882g*s/minEXPLORATORY_UNADJUSTED_INTERVAL
A2 — accumulated squared acceleration/min — exposure rate0.86909619699126630.6402697057604203 to 1.124275964625607g^2*s/minEXPLORATORY_UNADJUSTED_INTERVAL
J1 — accumulated absolute jerk/min — exposure rate109.6048372334332497.35611067782293 to 149.00667409185874g/minEXPLORATORY_UNADJUSTED_INTERVAL
J2 — accumulated squared jerk/min — exposure rate1264.8617827221594943.5119579510335 to 1897.1965192910434g^2/s/minEXPLORATORY_UNADJUSTED_INTERVAL

Scope, limitations and provenance

What this evidence can support

Retrospective N-of-1 observational aggregates; sessions, dates and activities are repeated observations of one participant.

These sensor-axis exposures cover native ACC recording time, which may be shorter than a full trip. They do not measure pain or establish clinical benefit or harm. Passenger miles are not equivalent to self-propelled miles.

Historical activity labels: 106 activities originally labeled “Horseback Riding” remain unknown vehicle type. That label is a proxy, not a vehicle identity; unknown activities are not assigned to Bus or another known vehicle.

WHOOP summary proxies: mean HR times duration is a summary proxy, not native HR integration or time above a threshold. WHOOP activity summaries remain distinct from native ACC observations.

  • No causal vehicle or seat effect; routes are not verified.
  • Native ACC exposure covers observed recording time, not necessarily a full trip.
  • ACC sensor-axis measures are not direct joint loading.
  • Passenger miles are not self-propelled output.
  • WHOOP mean HR times duration is a summary proxy, not native HR integration or time above threshold.
  • No telemetry-derived pain or clinical benefit/harm claim.
  • Entropy, HRV, seat contrasts, motorcycle comparator and episodic/longitudinal concordance are outside this projection.

Reviewed source run: 20260930T-LOCAL-CALC-MOB-02-V6. Projection status: REVIEWED_PUBLIC_PROJECTION.

Source manifest SHA-256: 8c5261465704ab5e8f1983753e6af7dcb8d719ecd1de9d10646a56a9941f93f7.

The same-origin file is an exact copy of the approved platform projection. Its publication_state records the upstream review snapshot, PLATFORM_ONLY_NOT_PUBLISHED; local publication approval is recorded separately in this site's allowlist. The website renders approved values without recomputing science.

CALC-MOB-02 projection Evidence Brief Open Evidence Observatory